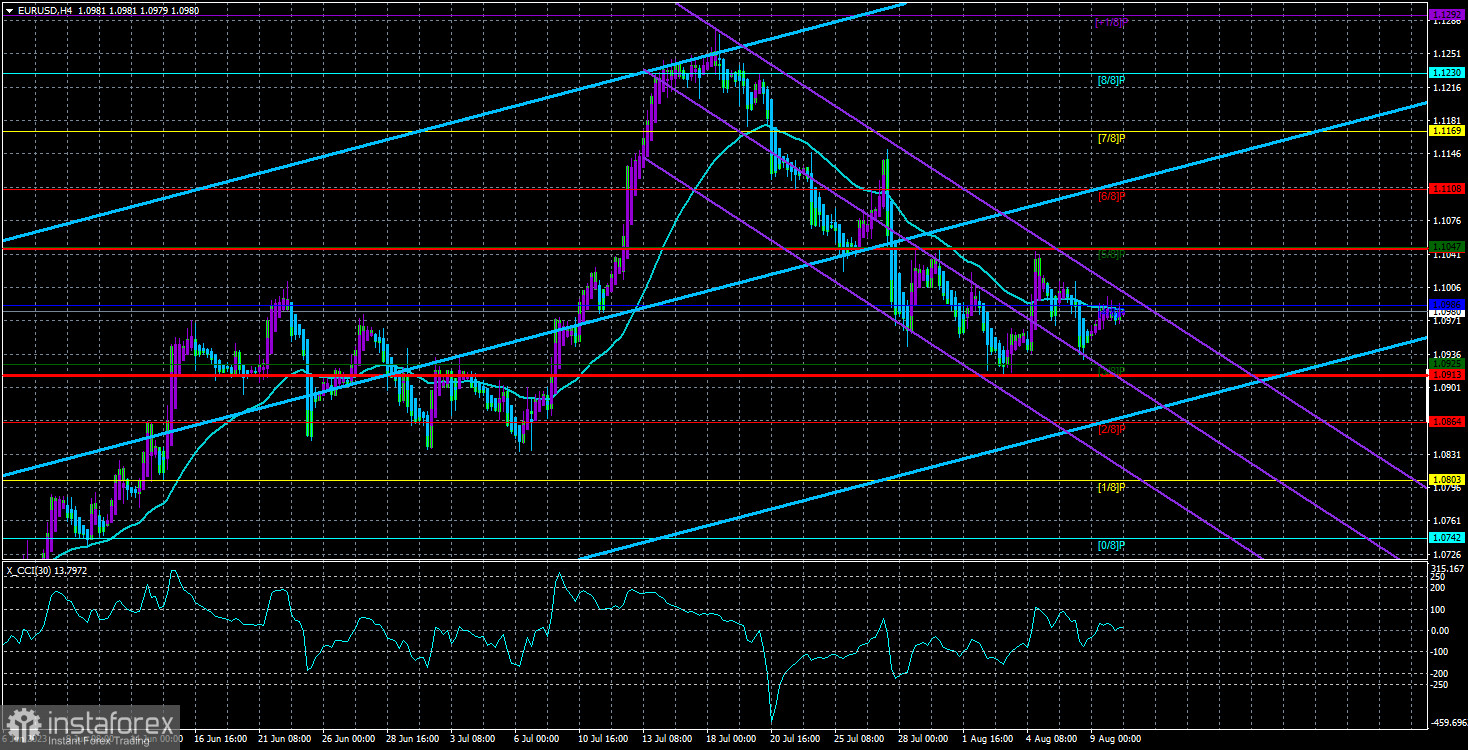
On Wednesday, the EUR/USD currency pair returned to the moving average line again, and the entire movement in recent weeks strongly resembles a flat trend. We have discussed the same in other articles where we analyze minor timeframes. A flat or sideways trend is easily observable, but it is hard to predict how long it will continue. Everything will depend on the macroeconomic and fundamental background, even though it has not been a primary focus for market participants lately. It's worth noting that the European currency and the pound have been appreciating for 11 months. Undoubtedly, it's not a continuous movement in one direction. Nevertheless, we don't see reasons for such strong growth.
Hence, the main strategy remains unchanged for now. The pair is expected to continue its decline in the medium term. Of course, as we observe now, there may be periods of bullish corrections or a flat trend. However, with each passing week, the euro has fewer and fewer purely hypothetical reasons to rise. As the market is flat, there's little more to add. The moving average line may be breached often, and the 24-hour timeframe remains the same. The decline should continue at least to the Senkou Span B line, which lies at 1.0863.
US inflation will influence the Federal Reserve's rate decision.
Today can rightly be called the most important day of the week. Not because there will be significant and abundant macroeconomic data but simply because there's data at all. The US inflation report is one of the most crucial for the market. The consumer price index will rise to 3.3% y/y in July. This is not alarming, as even macroeconomic indicators with a certain trend must undergo corrections. Therefore, an inflation increase of 3.3% doesn't mean it has stopped slowing down.
However, this could act as a "red flag" for the Federal Reserve. The Fed has repeatedly indicated its intention to combat inflation as soon as possible and has no plans to prolong this over several years. Thus, if US inflation rises today, we can expect the US dollar to strengthen. However, it may not rise as sharply as predicted, resulting in modest growth for the US currency. Whether this modest growth is enough to exit the sideways trend and end the flat movement is a big question. We doubt that the flat trend will end today. An inflation increase above 3% or a new slowdown could provoke a stronger movement in the pair.

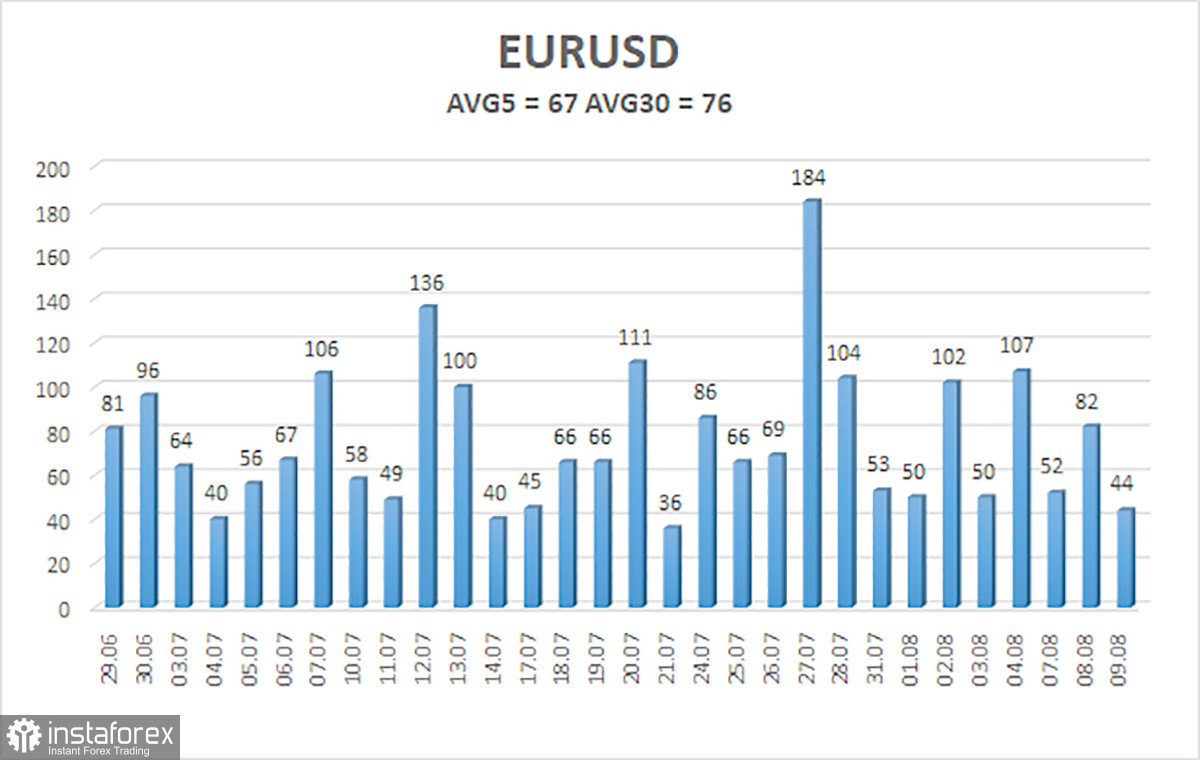
The average volatility of the euro/dollar currency pair over the last five trading days as of August 10th is 67 points, characterized as "medium." Therefore, we anticipate the pair's movement between the levels of 1.0913 and 1.1047 on Thursday. A downward reversal of the Heiken Ashi indicator will indicate a possible resumption of the downward movement.
Support Levels:
S1 – 1.0925
S2 – 1.0864
S3 – 1.0803
Resistance Levels:
R1 – 1.0986
R2 – 1.1047
R3 – 1.1169
Trading Recommendations:
The EUR/USD pair has begun an upward correction, smoothly transitioning into a flat trend. Currently, long positions can be considered with targets of 1.1047 and 1.1108 if the price consolidates above the moving average. Short positions can be taken in the case of a reversal of the Heiken Ashi indicator downwards or a rebound from the moving average, with targets of 1.0925 and 1.0913.
Explanations of the Illustrations:
- Linear Regression Channels help to identify the current trend. If both are directed in the same direction, the trend is strong.
- Moving Average Line (settings 20.0, smoothed) determines the short-term trend and the direction in which trading should be conducted.
- Murrey Levels are the target levels for movements and corrections.
- Volatility Levels (red lines) are the probable price channel in which the pair will spend the next day, based on current volatility indicators.
- CCI Indicator – its entry into the oversold area (below -250) or the overbought area (above +250) indicates an approaching trend reversal in the opposite direction.


