Details of the economic calendar on August 9
In the first half of the trading week, there were no significant macroeconomic events, and no statistical data was published either in Europe, the United Kingdom, or the United States.
Analysis of the trading charts from August 9
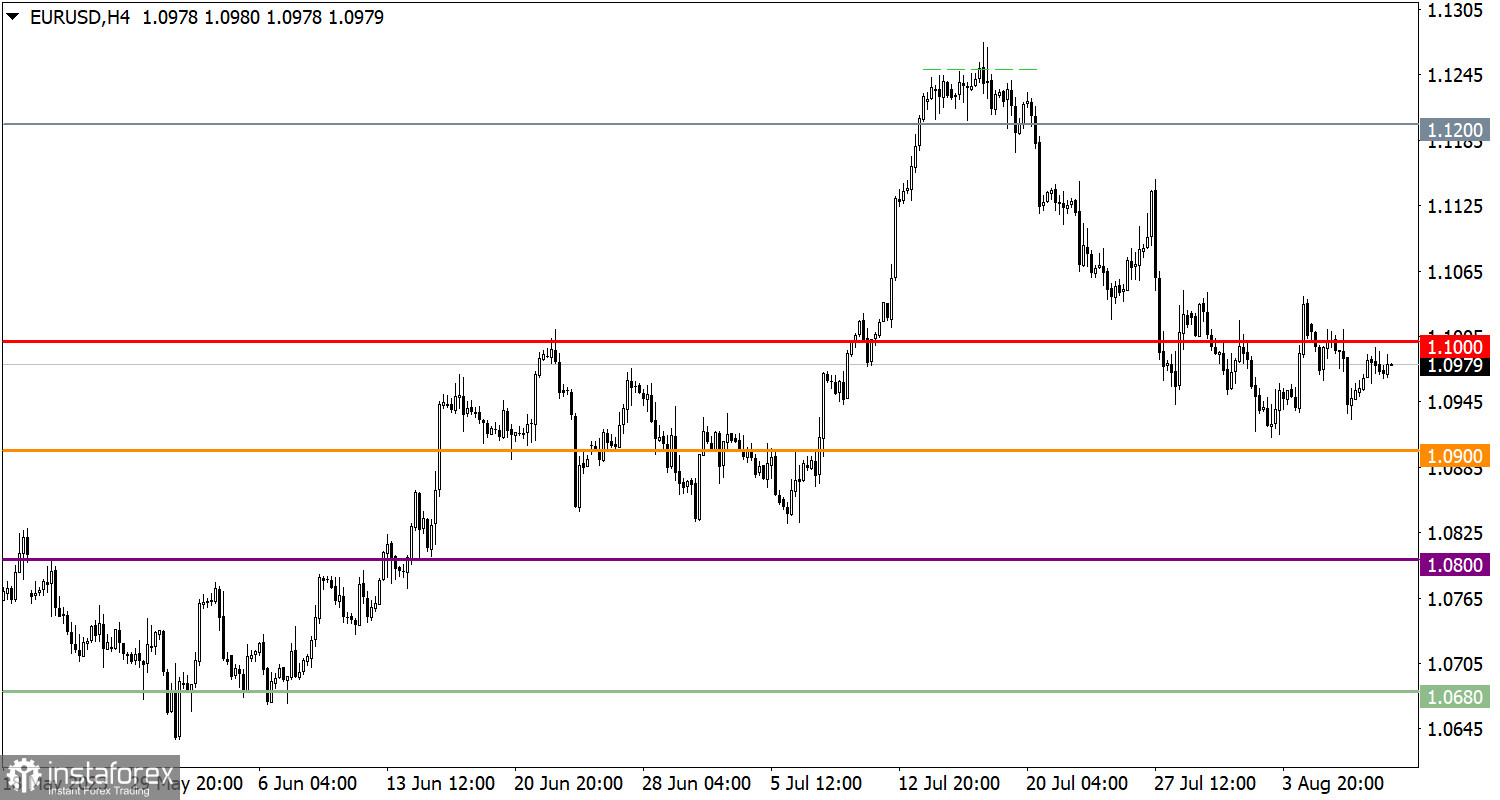
The EUR/USD exchange rate slowed down the pace of formation of the corrective movement. Instead, a rather broad sideways trend is observed, which traders analyze as a phase of regrouping of trading forces.
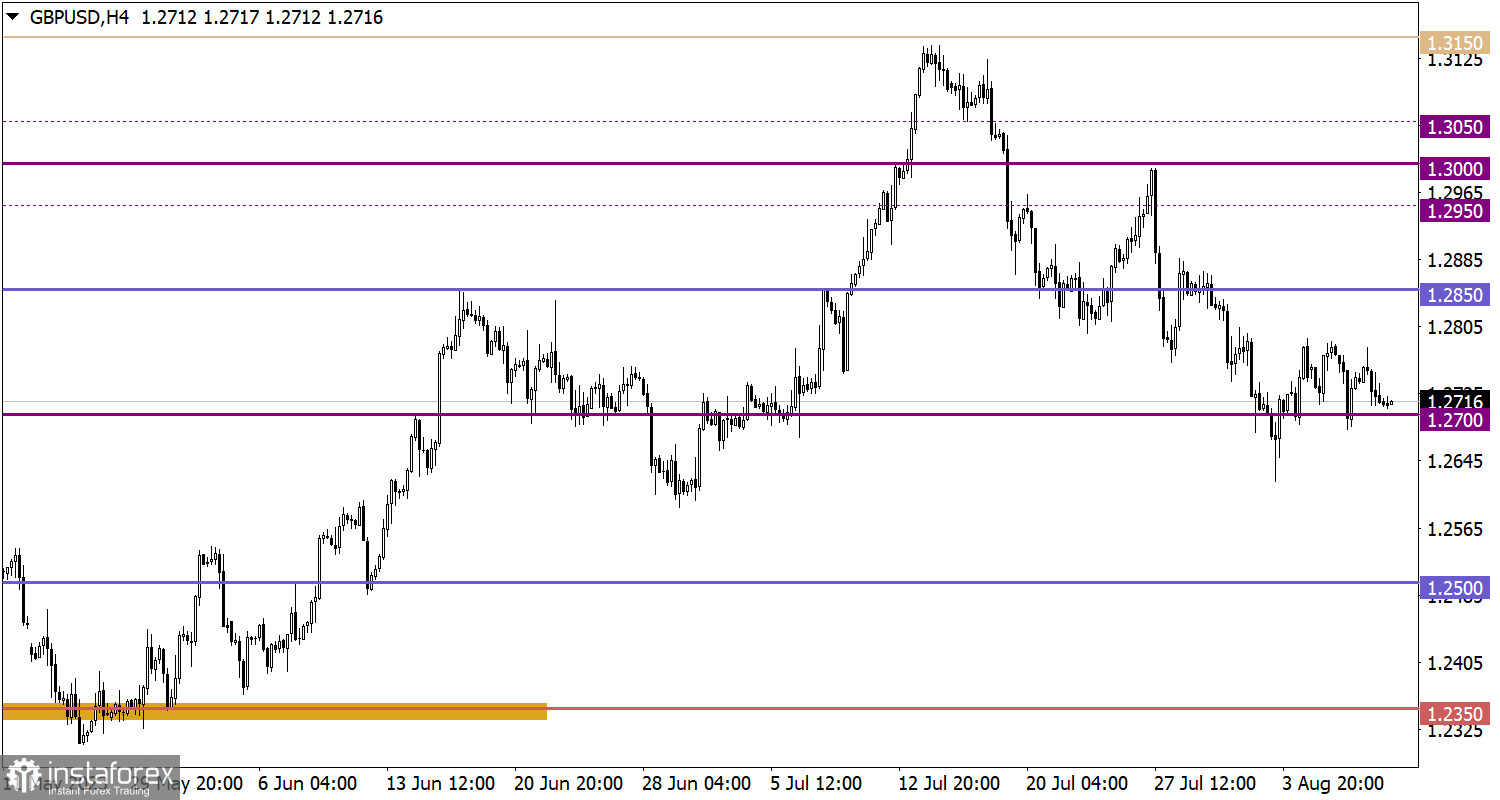
GBP/USD, despite the ongoing correction from the peak of the medium-term trend, is currently in a stagnation phase. The support level at 1.2700 plays a crucial role in this context, forming a fluctuation range between 1.2700 and 1.2780.

Economic Calendar for August 10
Today, investors' primary focus is on the long-awaited U.S. inflation report.
The U.S. Consumer Price Index may provide hints regarding the direction the Federal Reserve might take in its monetary policy. This becomes especially relevant after Friday's employment report raised concerns about the potential for prolonged high rates.
EUR/USD trading plan for August 10
In the current situation, a technical signal for a prolonged correction cycle will arise when the price holds below the 1.0900 mark. In this case, a subsequent increase in short positions volume might be possible. As for the growth scenario, it will become relevant if the price remains above the 1.1050 mark. Subsequent market developments might undergo a phased process of the euro's recovery, which might ultimately lead to the end of the current corrective movement.

GBP/USD trading plan for August 10
For the current corrective movement of the currency pair to continue, the quote must consistently remain below the 1.2700 level. Under such a condition, further movement in the direction of the price range between 1.2550 and 1.2600 is possible. However, a clear signal for an increase in long positions on the pound sterling might arise if the price holds above the 1.2800 mark. This signal could indicate the end of the current correction cycle.

What's on the charts
The candlestick chart type is white and black graphic rectangles with lines above and below. With a detailed analysis of each individual candle, you can see its characteristics relative to a particular time frame: opening price, closing price, intraday high and low.
Horizontal levels are price coordinates, relative to which a price may stop or reverse its trajectory. In the market, these levels are called support and resistance.
Circles and rectangles are highlighted examples where the price reversed in history. This color highlighting indicates horizontal lines that may put pressure on the asset's price in the future.
The up/down arrows are landmarks of the possible price direction in the future.


