GDP, labor market, and inflation data are crucial for the Federal Reserve when planning monetary policy parameters. If today's macro data, set to be released at 12:30 and 14:00 (GMT), also prove to be strong, the Fed leaders will have an additional argument in favor of a new interest rate hike or, at the very least, maintaining it at high levels. This is a negative factor for gold, whose prices are highly sensitive to changes in the monetary policy parameters of the world's major central banks, especially the Fed.
At the same time, there are also positive factors for gold. These include the continued high geopolitical uncertainty, the still-high inflation levels, potential economic growth issues, and expectations of a possible shift in the direction of the Fed's monetary policy.

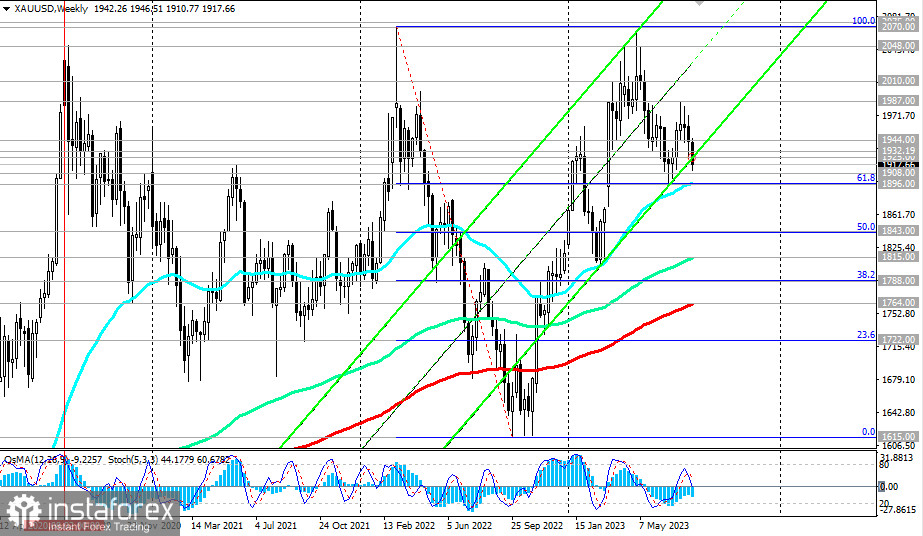
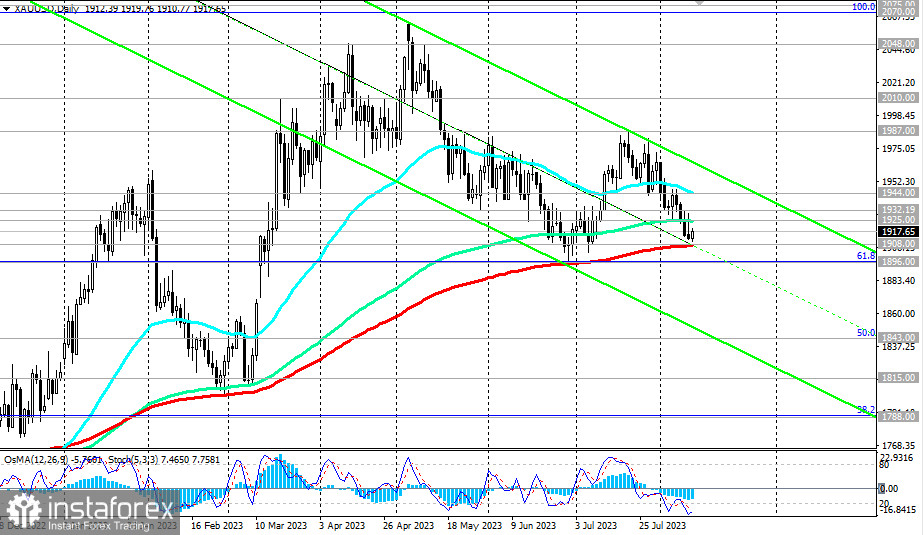
From a technical perspective, XAU/USD is approaching the key support levels of 1908.00 (200 EMA on the daily chart), 1896.00 (61.8% Fibonacci level in the downward correction wave from its peak at 2070.00 to its low at 1615.00 and 50 EMA on the weekly chart), which separates the medium-term bull market from the bear market.
Considering that XAU/USD remains in the long-term bull market zone, above the support levels of 1815.00 (144 EMA on the weekly chart), 1800.00, and 1764.00 (200 EMA on the weekly chart), it is logical to expect a rebound at the current levels and a resumption of growth.

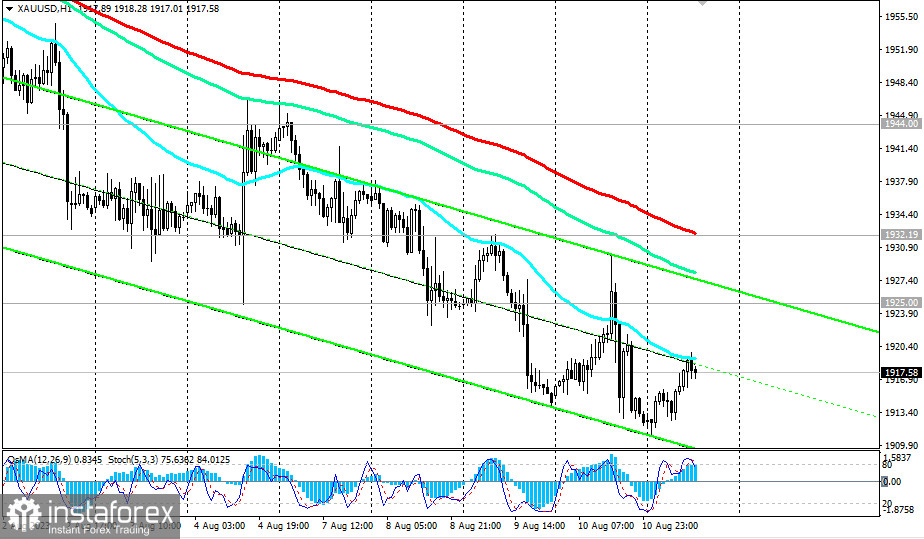
A confirmation signal for the resumption of the bullish trend would be a breakout of resistance levels 1925.00 (144 EMA on the daily chart), 1932.00 (200 EMA on the 1-hour chart), and 1954.00 (50 EMA on the daily chart, 200 EMA on the 4-hour chart).
With further growth, as we noted in our previous review, XAU/USD might again attempt to break through the psychological level of $2000 per ounce. This, in turn, could trigger another wave of frantic demand for gold and drive its prices towards recent record highs near the $2070 per ounce mark.
In an alternative scenario, if the price breaks through key support levels of 1908.00 and 1896.00, it will move deeper into the downward channel on the daily chart, towards its lower boundary and the 1843.00 mark (50.0% Fibonacci level).
Breaking through this level will pave the way for a deeper decline towards the key long-term support levels of 1815.00 (144 EMA on the weekly chart), 1788.00 (38.2% Fibonacci level), and 1764.00 (200 EMA on the weekly chart), separating the long-term bullish gold trend from the bearish one.
Yet, our primary scenario still involves an increase in gold prices and the XAU/USD pair.
However, much of the short-term dynamics of the pair will also depend on today's data from the U.S.
Support levels:1908.00, 1900.00, 1896.00, 1843.00, 1815.00, 1800.00, 1788.00, 1764.00
Resistance Levels:1925.00, 1932.00, 1944.00, 1987.00, 2000.00, 2010.00, 2048.00, 2070.00


