


The significant macro data from the U.S. released on Thursday, along with comments from the Federal Reserve leaders, confirmed the likelihood of maintaining the U.S. central bank's interest rate at high levels.
Nevertheless, the dollar strengthened at the end of Thursday, with its DXY index adding a symbolic 5 points to the previous trading day's closing price at 102.31.
Market participants today are awaiting additional inflation data from the U.S.: at 12:30 (GMT), the Bureau of Labor Statistics will release data on producer inflation.
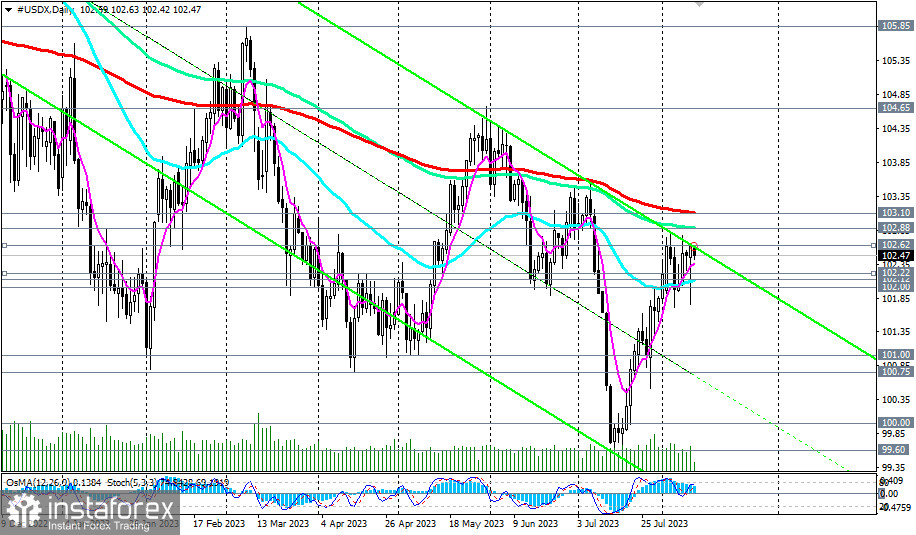
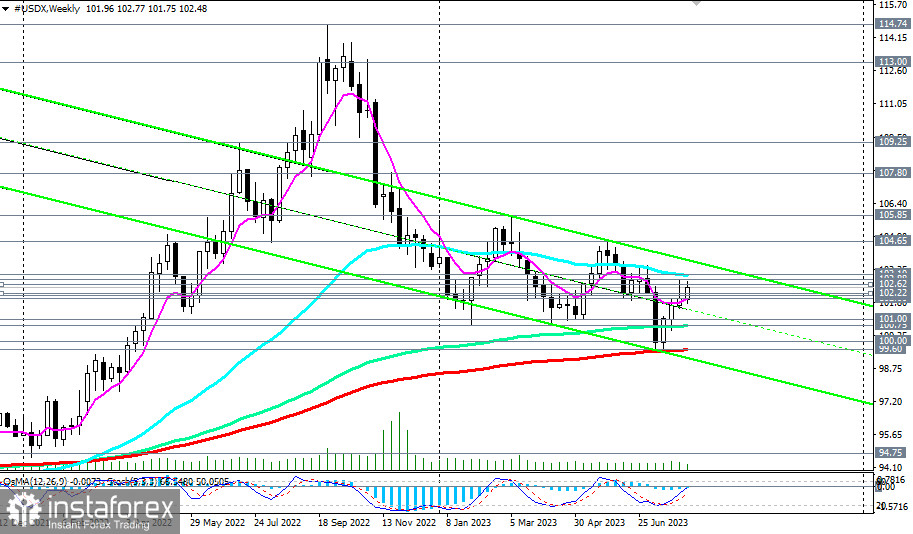
Overall, after yesterday's publications, the dollar remains stable, and its DXY index (CFD #USDX in the MT4 terminal) is close to the 102.48 mark, as of this writing, moving towards the nearest resistance at 102.65. If the positive momentum continues and after breaking through this local resistance level, the next targets for DXY will be 102.88 (144 EMA on the daily chart), 103.00, and 103.10 (200 EMA on the daily chart, 50 EMA on the weekly chart).
The first signal here will be breaking through the nearest local resistance level of 102.62, with targets close to the key medium-term resistance levels of 102.88 and 103.10. Breaking through these will move the DXY into the medium-term and return it to the long-term bullish markets zone.
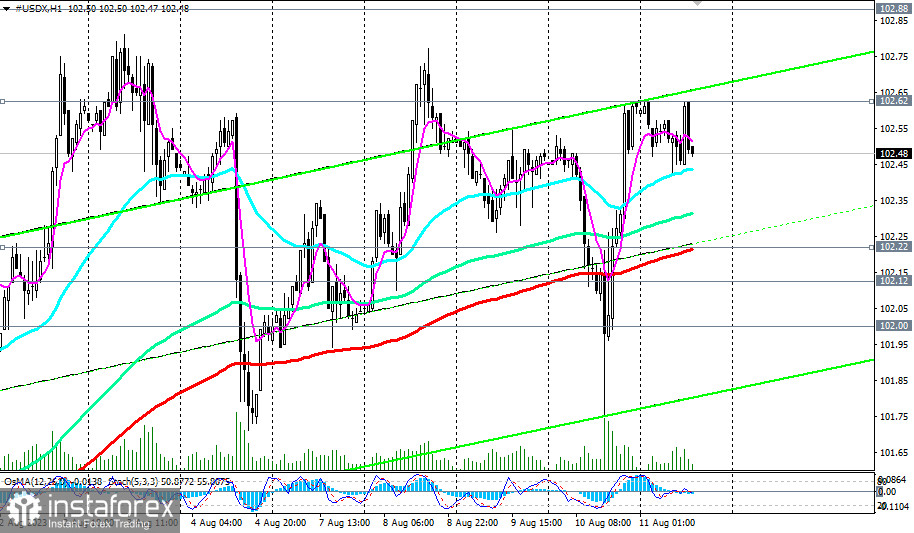
In an alternative scenario, a sequential break of the support levels 102.22 (200 EMA on the 1-hour chart), 102.12 (50 EMA on the daily chart), and 102.00 (200 EMA on the 4-hour chart) will bring the DXY back to the medium-term bear market zone and direct it within the downward channels on the daily and weekly charts.
Breaking through the key support level of 99.60 (200 EMA on the weekly chart) will place the DXY in the long-term bear market zone.
The "quickest" sell signal will be a break of the critical short-term support level of 102.42 (200 EMA on the 15-minute chart).
Support levels: 102.42, 102.22, 102.12, 102.00, 101.00, 100.75, 100.00, 99.60
Resistance levels: 102.62, 102.88, 103.00, 103.10, 104.00, 104.65, 105.00, 105.85


