A sharp increase in volatility is expected in the quotes of the Canadian and American dollars at 12:30 (GMT), which, in turn, should significantly increase the volatility in the USD/CAD pair.
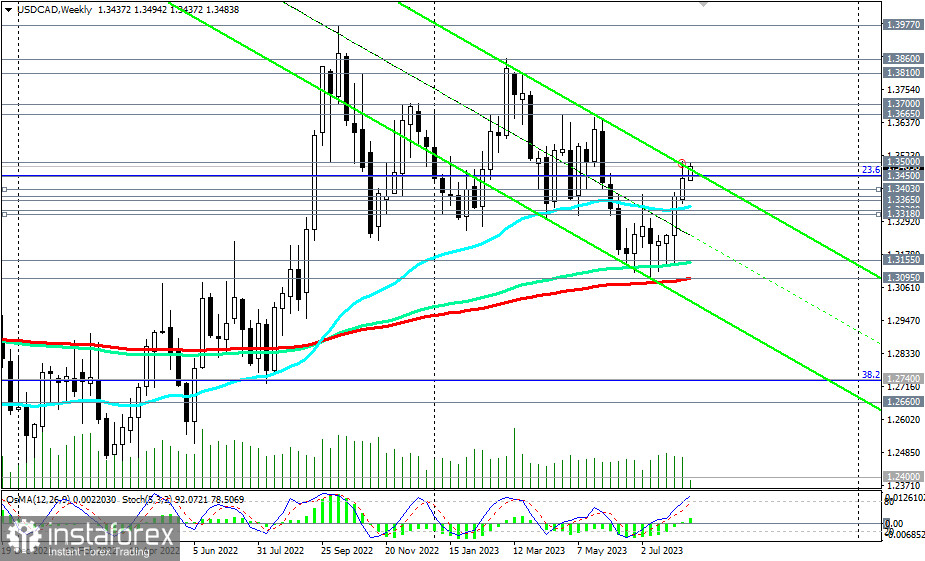
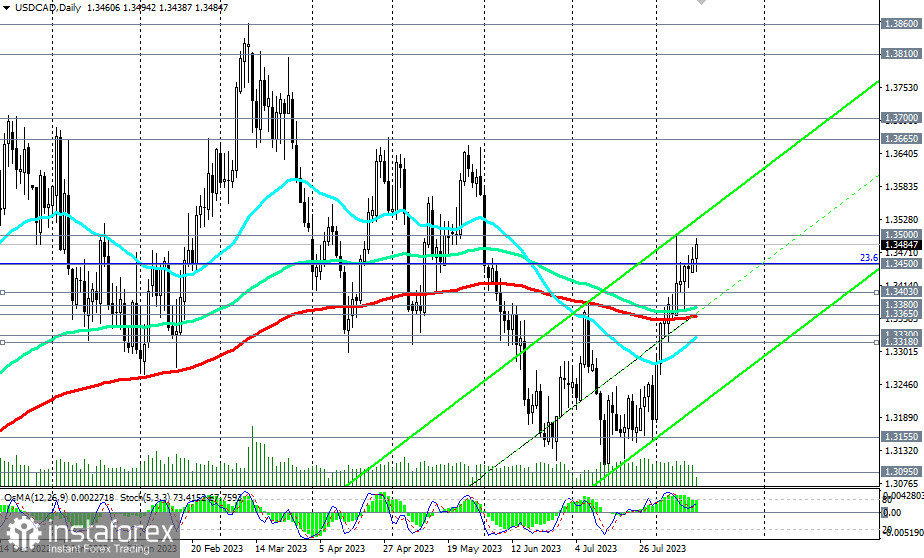
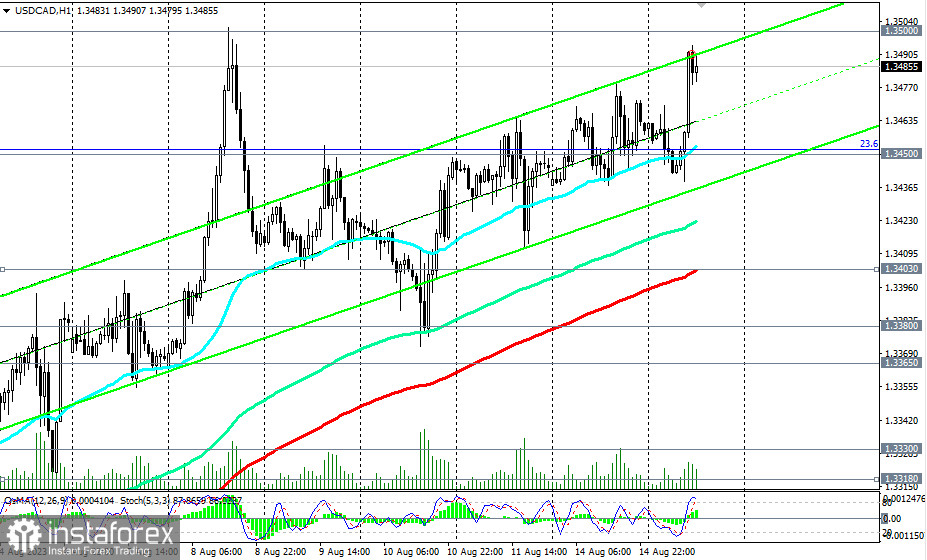
As of writing, it was trading near the 1.3485 mark, in close proximity to the local resistance level of 1.3500, corresponding to a 10-week high reached last week. This mark also coincides with the upper boundary of the downward channel on the weekly chart, and in case of a breakout, as well as considering the upward dynamics of the pair trading in the bull market zone, we expect further growth. The nearest target is the 1.3530 mark, through which the upper boundary of the upward channel on the daily chart runs, and more distant ones are the local resistance levels of 1.3665, 1.3700, 1.3810, 1.3860.

In an alternative scenario, USD/CAD will resume its decline. The first signal for selling is a break below the support level of 1.3450 (200 EMA on the 15-minute chart and 23.6% Fibonacci retracement level in the growth wave from 0.9700 to 1.4600, reached in June 2016) with a target at the important short-term support level of 1.3403 (200 EMA on the 1-hour chart).

With further development of this scenario, a break of the key support levels 1.3380 (144 EMA on the daily chart), 1.3365 (200 EMA on the daily chart) will return USD/CAD to the medium-term bear market zone, and a break of the support levels 1.3155 (144 EMA on the weekly chart), 1.3100, 1.3095 (200 EMA on the weekly chart) will bring it into the long-term bear market zone, making short positions preferable again.
Support levels: 1.3450, 1.3403, 1.3380, 1.3365, 1.3330, 1.3318, 1.3300, 1.3200, 1.3155, 1.3100, 1.3095
Resistance levels: 1.3500, 1.3530, 1.3600, 1.3665, 1.3700, 1.3810, 1.3860, 1.3900, 1.3970, 1.4000


