


Cable Down After Disappointing UK Retail Sales Data
Impact of UK Retail Sales on GBP: A Closer Look
The UK's retail sales data for December 2023 revealed a significant drop, with main sales down by 3.2% month-on-month, contrasting sharply with the forecasted 0.5% decrease. This decline is mirrored in the base monthly and annual figures, which also fell beyond expectations. This data highlights the UK's economic challenges, manifesting in the pound's downward trajectory. Interestingly, these developments hint at a potential interest rate cut, despite the recent uptick in inflation. The pound's response was a clear loss in value, especially against a strengthening dollar.

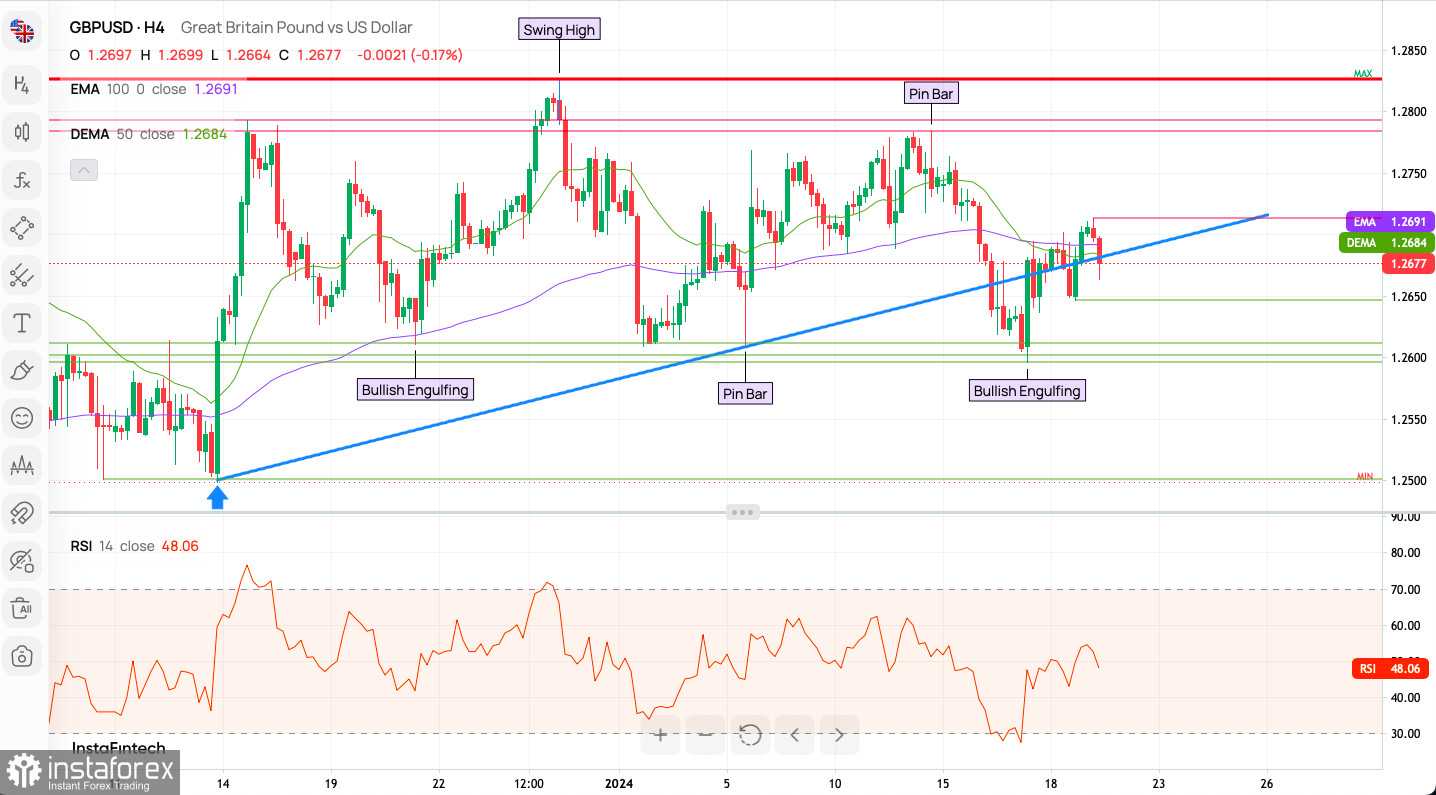
GBP/USD Technical Analysis: Short-term Perspective
Following the retail sales announcement, GBP/USD experienced a sharp decline, breaking key short-term support levels. At the time of writing, the pair reached a local low of 1.2664, temporarily placing bearish forces in control. Bearish targets are identified at 1.2646 and 1.2612, with 1.2711 acting as immediate technical resistance. The momentum on the H4 chart is shifting lower, suggesting a continued negative outlook in the short term.
Intraday Technical Indicators: GBP/USD
- Technical indicators display a predominantly bearish sentiment, with 15 out of 21 favoring a Sell signal. Neutrality is seen in 2 indicators, while 4 suggest a Buy.
- Moving averages also lean towards a bearish interpretation, with 17 out of 18 signaling Sell and only 1 indicating Buy.
Sentiment Analysis: Traders' Perspective
Despite the bearish technical signals, the general sentiment remains bullish, with a 60% majority over 40% bears. This bullish sentiment has been consistent over the past week and even strengthened in the last three days.
Weekly Pivot Points:
- Upper Resistance Levels: WR3 - 1.28232, WR2 - 1.27864, WR1 - 1.27714
- Pivot Point: 1.27496
- Lower Support Levels: WS1 - 1.27346, WS2 - 1.27128, WS3 - 1.26760
Trading Insights:
- The recent trendline break suggests a bearish outlook, but bullish patterns and support level rebounds indicate potential for a rally.
- The RSI suggests diminishing selling momentum, but without a clear oversold signal, a swift reversal is not certain.
- Monitoring the price relationship with EMA and DEMA is crucial. A sustained move above these averages could signal a shift towards bullish momentum.
- It is vital to observe the price maintaining above crucial short-term support levels to avoid further declines.
Trading Scenarios:
For bullish traders, a rebound from key support levels and a sustained move above moving averages could offer an opportunity. Conversely, bears might look for a further breakdown below current support, particularly if the bearish momentum on technical indicators continues. As always, traders should remain aware of the inherent risks and volatility in the forex market.
Useful Links
Important Notice
The begginers in forex trading need to be very careful when making decisions about entering the market. Before the release of important reports, it is best to stay out of the market to avoid being caught in sharp market fluctuations due to increased volatility. If you decide to trade during the news release, then always place stop orders to minimize losses.
Without placing stop orders, you can very quickly lose your entire deposit, especially if you do not use money management and trade large volumes. For successful trading, you need to have a clear trading plan and stay focues and disciplined. Spontaneous trading decision based on the current market situation is an inherently losing strategy for a scalper or daytrader.


