


EUR/USD Steady Ahead of Eurozone CPI Data Release
Key Takeaways:
- EUR/USD under bearish pressure with a recent break below key support.
- Mixed market indicators suggest uncertainty, with a slight bullish sentiment.
- Watch for pivotal movements around resistance and support levels for trading insights.
Overview of Today's Economic CalendarToday's global economic calendar lacks significant U.S. macroeconomic reports, but highlights data from Europe. UK and Canada retail sales are in focus, expected at -0.5% and -0.1% month-on-month, respectively. Later, the U.S. market draws attention with the University of Michigan report and speeches from FOMC members Barr and Daly.

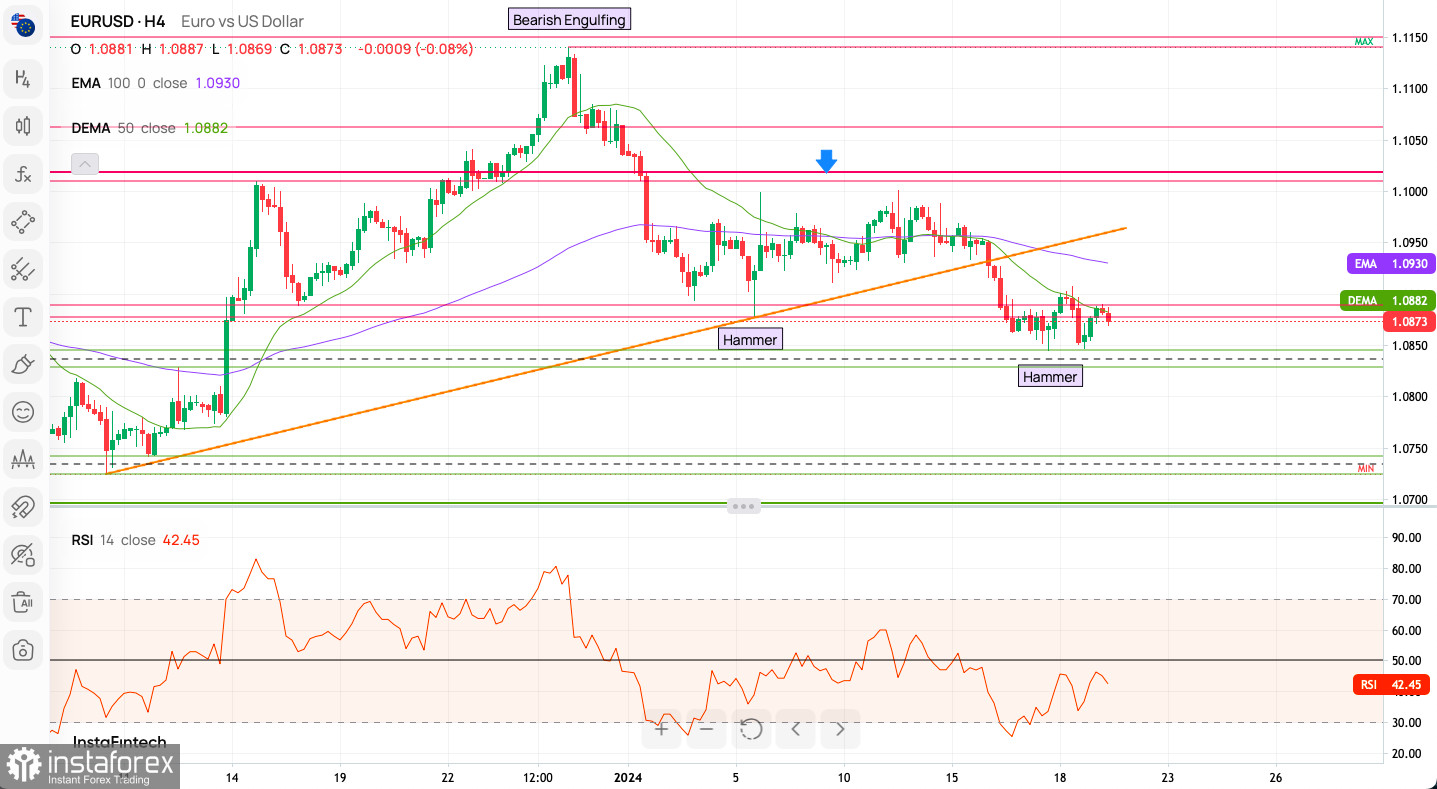
Technical Analysis - EUR/USD's Market PositioningThe EUR/USD pair breached the 1.0928 support, dropping to a new local low of 1.0845, hinting at bearish momentum. Critical support is eyed at 1.0825; a break below could lead to December 2023's lows at 1.0723. Resistance lies at 1.0877 and 1.0898 (50 DEMA), marking a supply zone. Bulls require a breakout above this to shift the trend.
Candlestick Patterns and Moving AveragesA Hammer pattern suggests a potential bullish reversal, with its long lower shadow indicating buying interest. Earlier, a Bearish Engulfing pattern signaled a bearish turn. The EMA and DEMA provide insight into resistance and short-term trends.
Trend Lines and IndicatorsA broken upward-sloping orange line indicates lost long-term support, a bearish sign. The RSI at 44.30, near the oversold territory, suggests a possible uptick.
Intraday Indicator Analysis and Market SentimentIntraday indicators show mixed signals, with 5 out of 22 favoring buying and 8 for selling. Moving averages are similarly divided. Current sentiment leans bullish, with a 60% majority over 40% bears.
Weekly Pivot Points and Key Levels
WR3 - 1.10093
WR2 - 1.09826
WR1 - 1.09714
Weekly Pivot - 1.09559
WS1 - 1.09447
WS2 - 1.09292
WS3 - 1.09025
Trading Insights for Bulls and Bears
Key Points to Watch:
For a bullish scenario: Confirmation of the Hammer pattern with an upward price movement, preferably breaking above the resistance trend line and the moving averages.
For a bearish scenario: A break below the Hammer's low, indicating the market has rejected the potential bullish reversal signal and may continue downwards.
Potential Strategies:
Bullish: Look for entry points if the price breaks and holds above the resistance trend line, using the moving averages as dynamic support.
Bearish: Continue to follow the downtrend, but be wary of potential reversal signals and consider taking profits or tightening stop losses near the oversold RSI region.
Useful Links
Important Notice
The begginers in forex trading need to be very careful when making decisions about entering the market. Before the release of important reports, it is best to stay out of the market to avoid being caught in sharp market fluctuations due to increased volatility. If you decide to trade during the news release, then always place stop orders to minimize losses.
Without placing stop orders, you can very quickly lose your entire deposit, especially if you do not use money management and trade large volumes. For successful trading, you need to have a clear trading plan and stay focues and disciplined. Spontaneous trading decision based on the current market situation is an inherently losing strategy for a scalper or daytrader.


