The Australian dollar remains under pressure. It is weakening not only against the U.S. dollar but also against major currencies in popular cross pairs, particularly the EUR/AUD pair.
At the end of the month, fresh consumer inflation data will be released in Australia, and if it confirms a slowdown, the Reserve Bank of Australia (RBA) will likely pause interest rate hikes at its September meeting. If the interest rate is increased, it would likely be the last hike in the current cycle of tightening monetary policy by the RBA, which is expected to be a bearish factor for the Australian dollar.

The situation at the European Central Bank (ECB) is slightly different, with a different approach to monetary policy changes. Preliminary data shows that the Eurozone Consumer Price Index (CPI) decreased to -0.1% in July (from +0.3% previously) and +5.3% year-on-year (from +5.5% the previous month). Nevertheless, unlike the RBA, the ECB does not plan to pause its interest rate hikes, which will support the euro, economists believe. The difference in approaches to monetary policy changes will likely contribute to further strengthening of the euro against the Australian dollar.
Next Tuesday, fresh business activity indicators will be published in Australia, and on Wednesday, in Germany and the Eurozone, which could give the EUR/AUD pair a new boost.

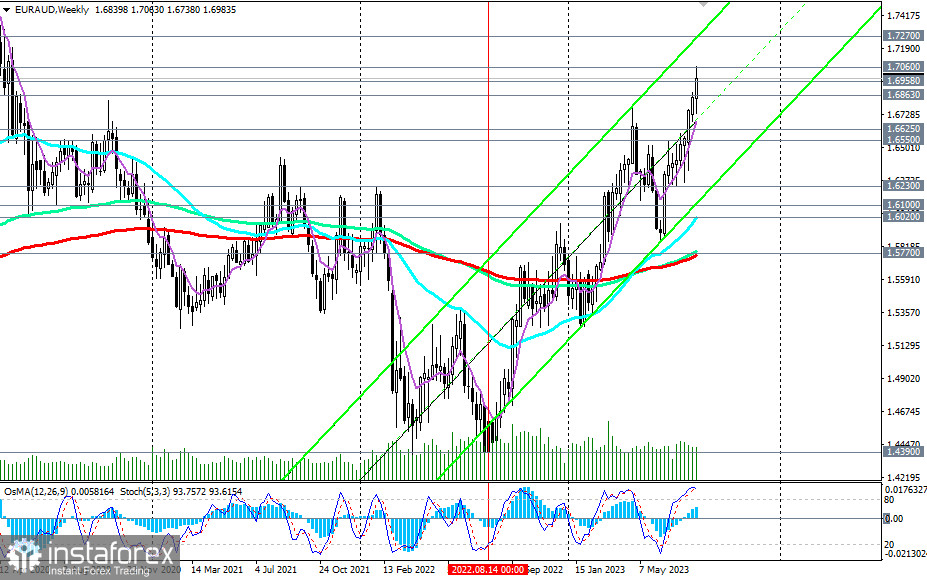
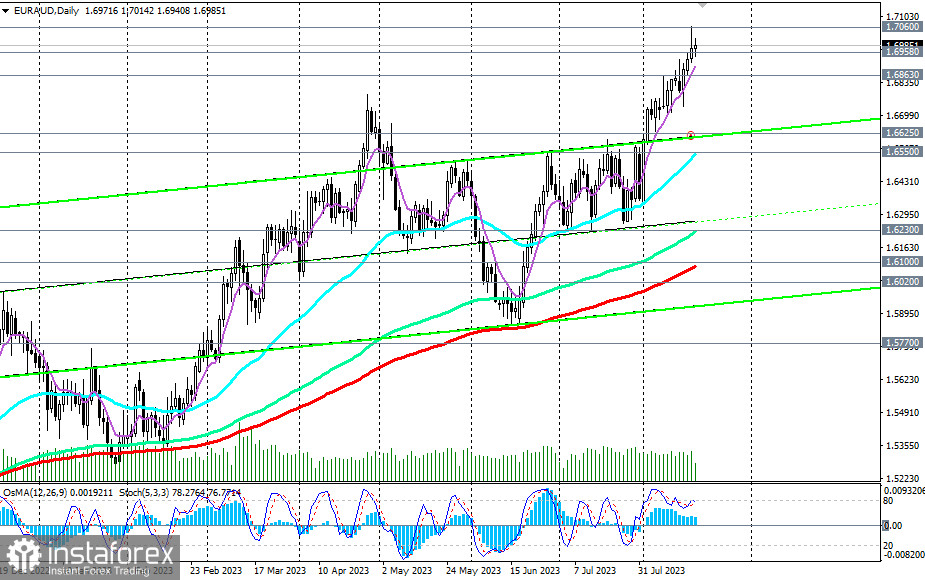
Since mid-August of the previous year, EUR/AUD has been rising and continues to maintain positive dynamics, trading in a bullish market above key support levels of 1.6100 (200 EMA on the daily chart) and 1.5770 (200 EMA, 144 EMA on the weekly chart). A break above the May 2020 and this week's high at 1.7063 would open the way for the pair to rise towards the upper boundary of the upward channel on the weekly chart and levels of 1.7200 and 1.7270.
The OsMA and Stochastic indicators on the daily and weekly charts are also on the buyers' side, with the Stochastic not leaving the overbought zone, indicating a strong bullish impulse.
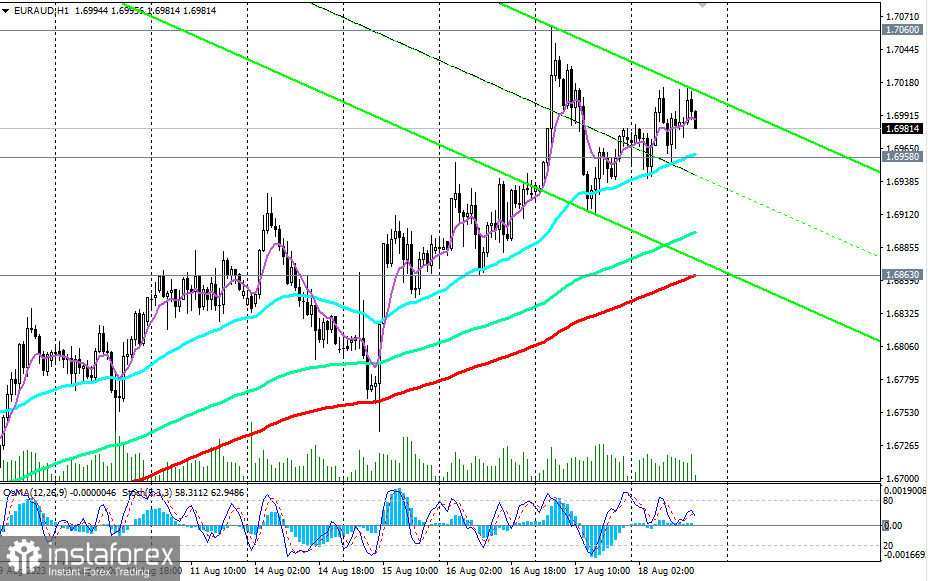
An alternative scenario, if it occurs, would involve a break of the crucial short-term support level at 1.6836 (200 EMA on the 1-hour chart) and a decline towards support levels of 1.6625 (200 EMA on the 4-hour chart) and 1.6550 (50 EMA on the daily chart). A deeper correction is currently unlikely.
Support levels: 1.6958, 1.6863, 1.6625, 1.6600, 1.6550, 1.6230, 1.6100, 1.6020, 1.5770
Resistance levels: 1.7060, 1.7100, 1.7200, 1.7270, 1.7300


