


Details of the economic calendar on August 18
Data on retail sales in the United Kingdom showed a more significant decline, reaching a mark of -3.2% year-on-year. As a result of this news event, the value of the British pound decreased. In the European Union, inflation data was published, which slowed down to 5.3%. However, note that these are final data, fully in line with the preliminary assessment. In this regard, the market reaction was minimal.
Analysis of trading charts from August 18
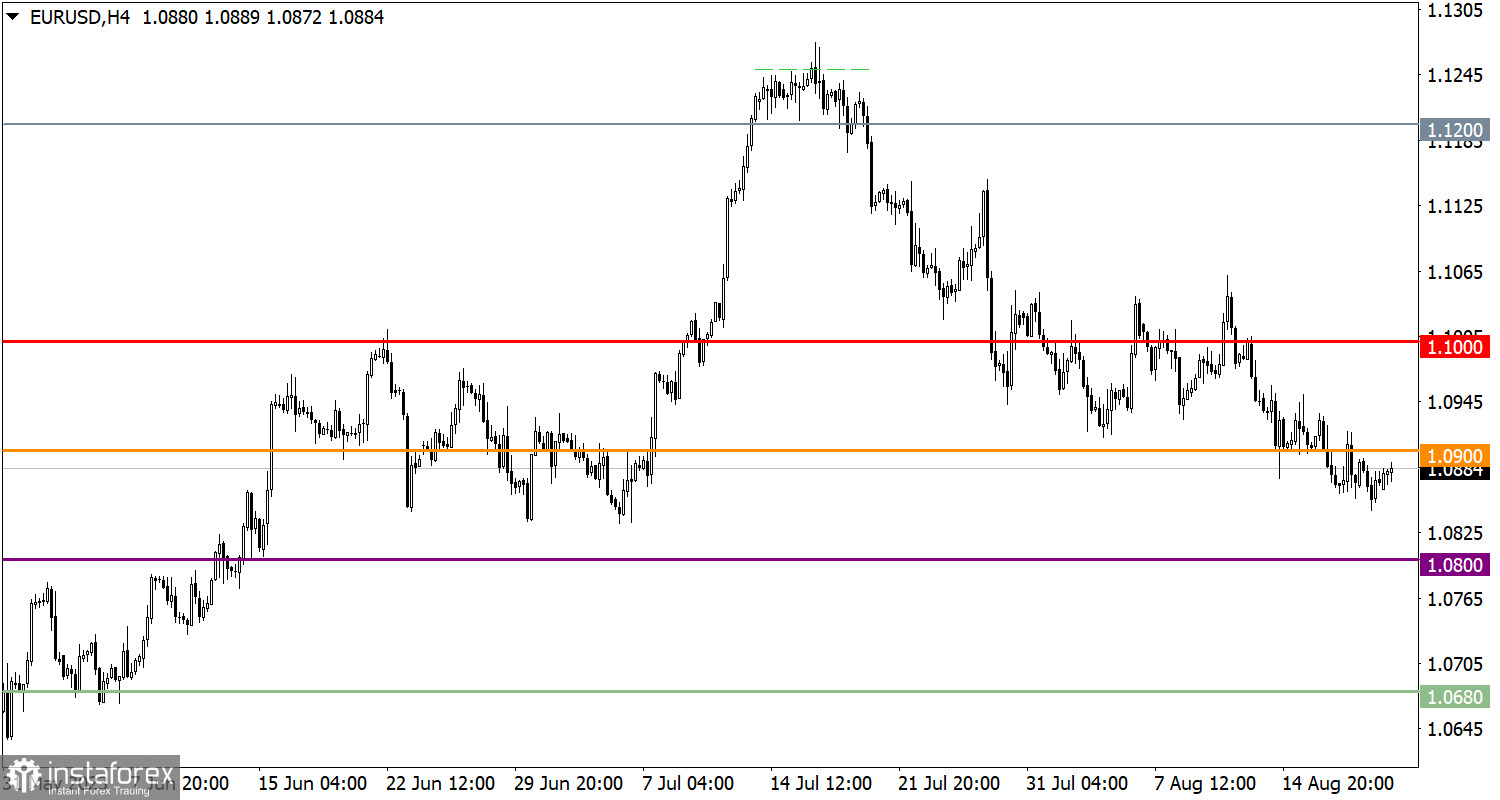
The EUR/USD currency pair is at the low of the correction cycle, indicating a prevailing downward mood among market participants.
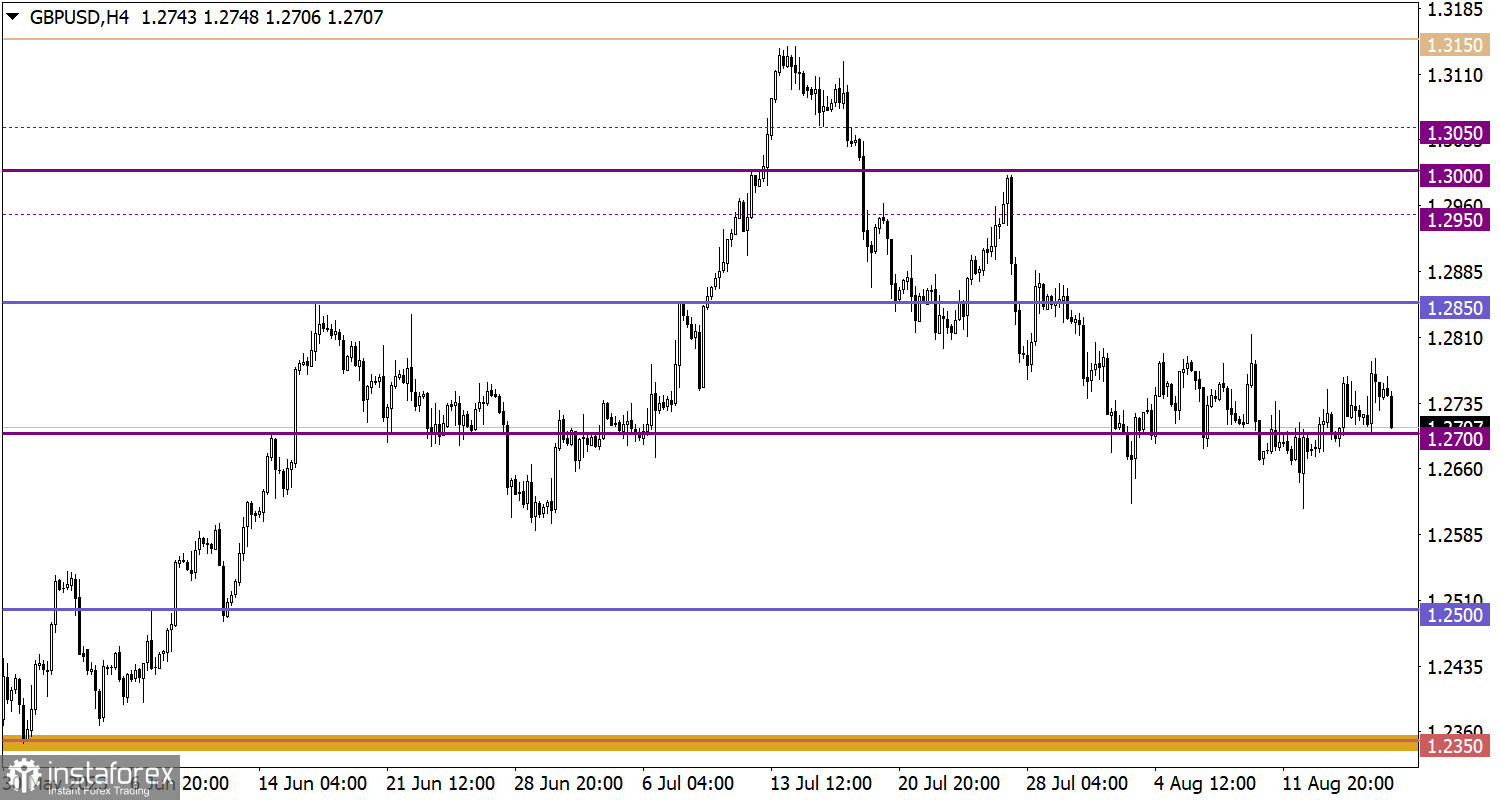
GBP/USD continues to move without significant changes within the sideways range for the third week in a row. This movement indicates a slowdown in the current corrective movement in the market, which began with the local high of the medium-term trend.
Economic Calendar for August 21
Monday, as usual, is accompanied by an empty macroeconomic calendar. No major statistical data releases are expected in the European Union, the United Kingdom, or the United States.
In this regard, investors and traders will likely focus on the incoming information and news flow for decision-making in the market.

EUR/USD trading plan for August 21
If the volume of short positions increases, quotes will likely decline to the 1.0800 mark. In this scenario, the overall correction scale would be 4%, which already signals the evident overselling of the euro. At the same time, if there is stagnation at this stage and the quote returns above the 1.0900 level, there may be talks of the end of the correction phase.
GBP/USD trading plan for August 21
In this situation, speculators pay special attention to the boundaries of the flat, as going beyond the control levels may cause changes in the distribution of trading forces in the market.
The decline scenario will be relevant if the price is consistently held below the 1.2650 mark. This condition may contribute to the continuation of the downward correction cycle.
The growth scenario involves a gradual recovery of the British pound's value concerning the current corrective movement. The primary technical signal for possible growth may appear if the price remains above the 1.2800 mark.
What's on the charts
The candlestick chart type is white and black graphic rectangles with lines above and below. With a detailed analysis of each individual candle, you can see its characteristics relative to a particular time frame: opening price, closing price, intraday high and low.
Horizontal levels are price coordinates, relative to which a price may stop or reverse its trajectory. In the market, these levels are called support and resistance.
Circles and rectangles are highlighted examples where the price reversed in history. This color highlighting indicates horizontal lines that may put pressure on the asset's price in the future.
The up/down arrows are landmarks of the possible price direction in the future.


