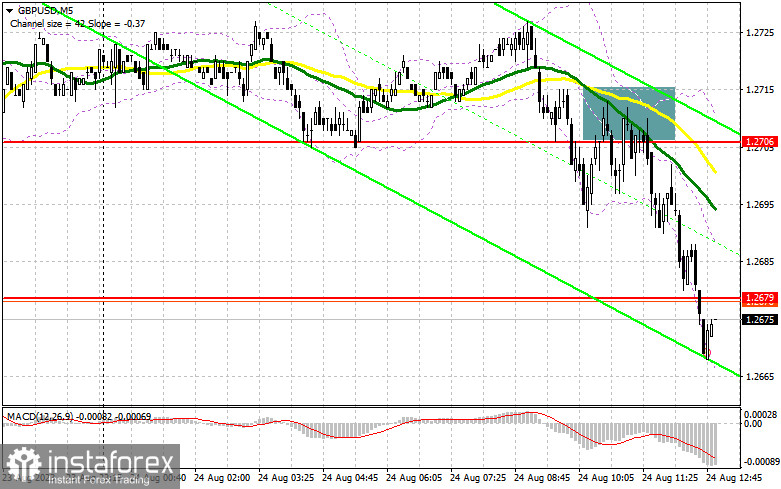
In my morning forecast, I pointed out the 1.2706 level and recommended making market entry decisions based on it. Looking at the 5-minute chart, we can analyze what happened there. The breakthrough and retest of this range resulted in an excellent sell signal, leading to a 30-point drop. The technical outlook was revised for the latter part of the day.

For opening long positions in GBP/USD:
The pound's ability to quickly recover from its morning drop was evident yesterday. So now, all eyes are on the key US data that many buyers are counting on. Primarily, the focus will be on data related to initial unemployment claims and changes in the volume of orders for durable goods. Poor indicators for increased benefits could weaken dollar demand, as might the comments from FOMC member Patrick T. Harker, who leaned towards further interest rate hikes yesterday. Still, they might have changed their opinion after releasing the PMI indices.
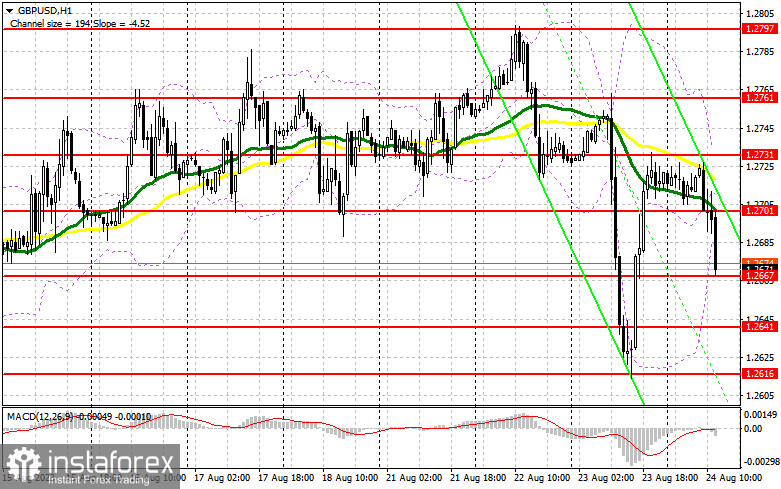
Given the volatile market, I plan to act on declines after forming a false breakout around the new support of 1.2667, established yesterday. This may provide not a perfect but a decent entry point, targeting resistance at 1.2701. A breakthrough and top-down test of this range against weak US data would form an additional buy signal, strengthening the pound and allowing it to reach 1.2731. If it exceeds this range, we can anticipate a surge to 1.2761, where I'll lock in profits. If GBP/USD falls and no buyers appear at 1.2667, which is also likely, the pressure on the pair will continue, leading to a significant sell-off. If this happens, I'll delay long positions until 1.2641. Buying there will only occur on a false breakout. You can immediately open long positions on GBP/USD at a rebound from 1.2616, aiming for a 30-35 point correction within the day.
For opening short positions in GBP/USD:
The bears have once again made their presence felt, but traders, having learned from yesterday's bitter experience, might act more cautiously today. For this reason, I'll wait for GBP/USD to recover after weak US data and form a false breakout around 1.2701. Only this will signal a sell, anticipating a further decline and testing the nearest support at 1.2667. Similar to what I discussed above, a breakthrough and a bottom-up retest of this range will provide a sell entry point with a renewal to 1.2641, reinforcing the sellers' market presence. A further target will be the 1.2616 area, where I'll lock in profits. Bulls will try to re-enter the market if GBP/USD rises and there's no bearish activity at 1.2701 in the latter part of the day. In such a case, only a false breakout around the next resistance at 1.2731 will form a short entry point. If there's no activity, I advise selling GBP/USD from 1.2761, aiming for a 30-35 point rebound downward within the day.


Indicator signals:
Moving Averages:
Trading is conducted below the 30- and 50-day moving averages, indicating a further decline in the pound.
Note: The author considers the moving average periods and prices on the H1 hourly chart and differs from the general definition of classic daily moving averages on the D1 daily chart.
Bollinger Bands:
In the event of a decrease, the lower boundary of the indicator will act as support around 1.2665.
Description of Indicators:
- Moving Average: Determines the current trend by smoothing volatility and noise. Period 50. Marked in yellow on the chart.
- Moving Average: Determines the current trend by smoothing volatility and noise. Period 30. Marked in green on the chart.
- MACD Indicator (Moving Average Convergence/Divergence): Fast EMA period 12. Slow EMA period 26. SMA period 9
- Bollinger Bands: Period 20
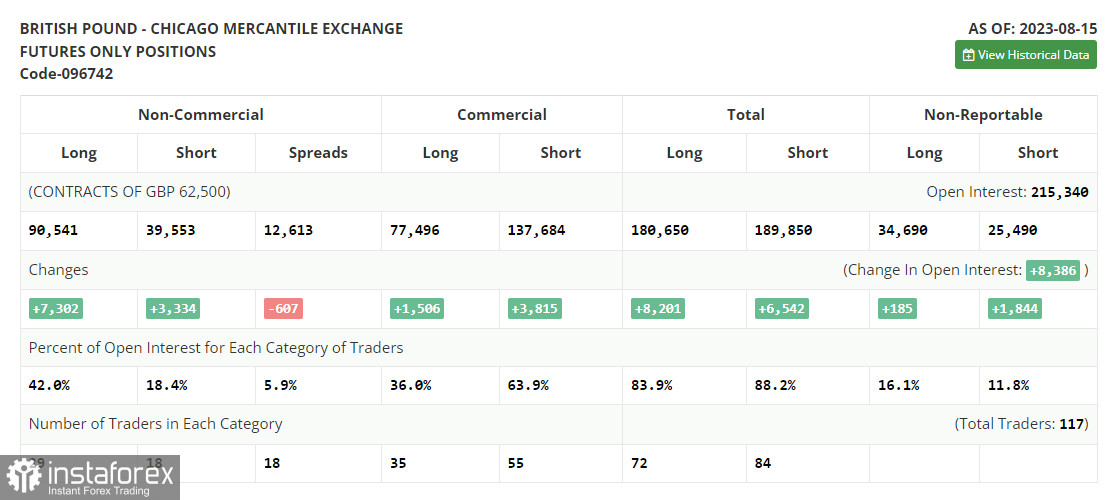
- Non-commercial traders: Speculators such as individual traders, hedge funds, and major institutions that use the futures market for speculative purposes and meet specific requirements.
- Non-commercial long positions represent the total long open positions of non-commercial traders.
- Non-commercial short positions represent the total short open positions of non-commercial traders.
- The total net non-commercial position is the difference between non-commercial traders' short and long positions.


