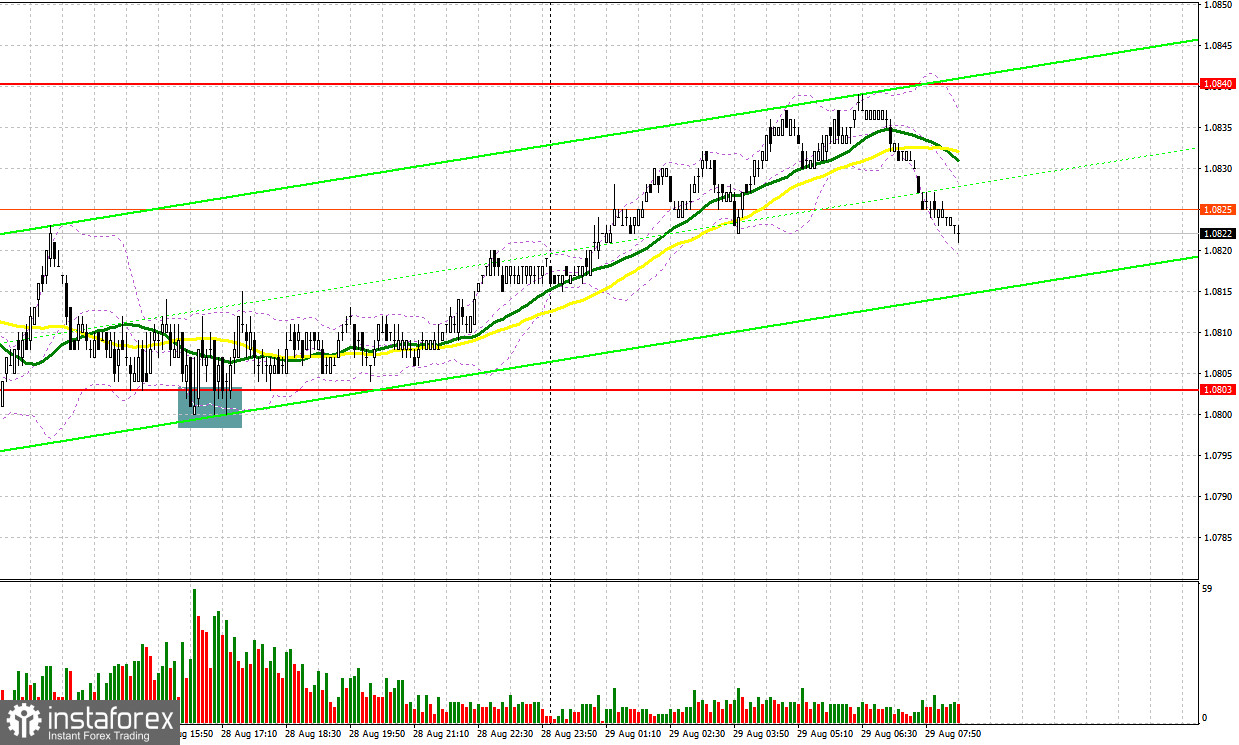
Yesterday, the pair formed several signals to enter the market. Let's see what happened on the 5-minute chart. In my morning review, I mentioned the level of 1.0803 as a possible entry point. A decline to this level and its false breakout formed an excellent entry point to buy the euro. As a result, the pair jumped by almost 20 pips. In the afternoon, amid the lack of any news background, the buyers made a similar move around the level of 1.0803, sending the price up by another 20 pips and generating another entry point for going long.

COT report
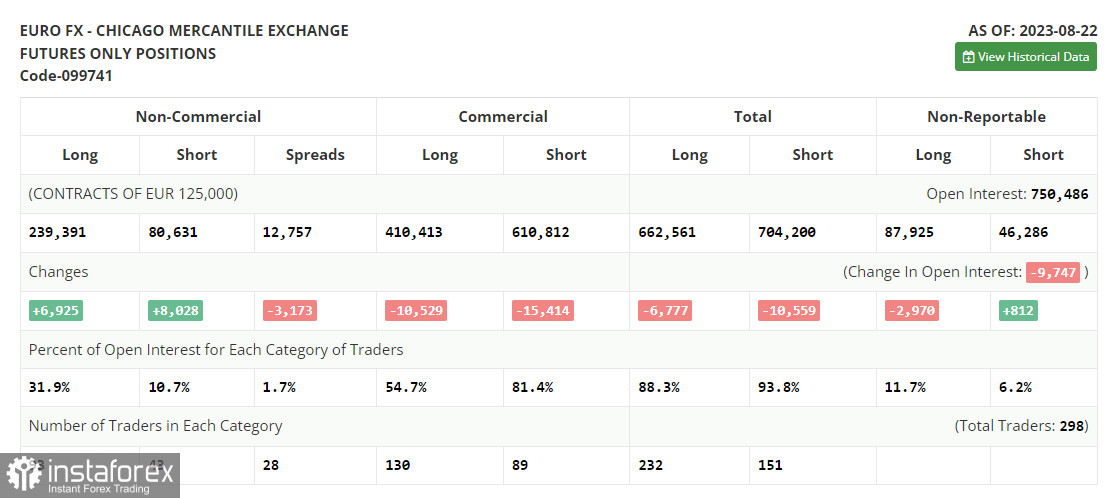
Before discussing the prospects of EUR/USD, let's take a look at what happened in the futures market and how the Commitments of Traders (COT) report has changed. The COT report for August 22 recorded a rise in both long and short positions. Considering the release of rather weak PMI data in the US, indicating economic contraction, as well as hawkish comments from Federal Reserve Chairman Jerome Powell during the Jackson Hole Symposium, it is not surprising that there were slightly more short positions than the long ones. However, the decline in the euro presents an attractive opportunity for traders, and the optimal medium-term strategy in the current conditions remains to buy risk assets on dips. According to the COT report, non-commercial long positions increased by 6,925 to reach 239,391, while non-commercial short positions jumped by 8,028 to 80,028. As a result, the spread between long and short positions decreased by 3,173. The closing price dropped to 1.0866 from 1.0922, indicating a bearish market sentiment.

For long positions on EUR/USD
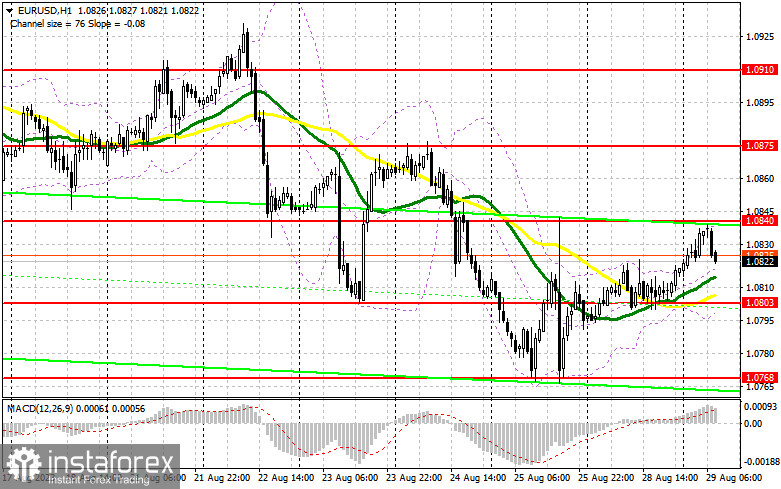
The release of the leading German Consumer Climate index scheduled for today is unlikely to significantly impact market direction. However, the downbeat data could put pressure on the pair, bringing it back to the mid-range of the sideways channel at 1.0803. Currently, the area is marked by moving averages favoring bulls. Another false breakout at 1.0803, similar to what we discussed earlier, would provide an excellent entry point for long positions. If so, we can expect the resumption of the upside correction towards the nearest resistance at 1.0840. A breakout and successful test of this range from top to bottom would strengthen demand for the euro, potentially pushing it toward 1.0875. The ultimate target remains around 1.0910, signaling a shift of control to euro buyers. I will take profits there. If EUR/USD declines and bulls fail to hold at 1.0803 after weak German data, bears will become more active, likely aiming for the extension of the downtrend. Therefore, a false breakout around the next support at 1.0768 would be a buy signal for the euro. I plan to initiate long positions on a rebound from the low of 1.0734, keeping in mind an intraday upward correction of 30-35 pips.
For short positions on EUR/USD
Sellers attempted multiple times to break below 1.0803 yesterday, but these attempts were unsuccessful. Given the current conditions, it would be wise to consider selling the pair around the upper boundary of the sideways channel at 1.0840, where the price may surge in the near future. Only a false breakout at this level would signal a selling opportunity and may potentially lead to a decline toward the support level of 1.0803. However, I anticipate a sell signal only after a breakout and sustained movement below this range, followed by a retest from below. This could pave the way for the low of 1.0768, where larger buyers might emerge. The ultimate target would be around 1.0734, where I will be taking profits. If EUR/USD rises during the European session and bears are absent at 1.0840, bulls might attempt a comeback. In this scenario, I would only go short when the price hits the new resistance at 1.0875. Selling will be possible at this point but only after a failed consolidation. Opening short positions immediately on a rebound would be a viable strategy from the high of 1.0910, considering a downward correction of 30-35 pips.

Indicator signals:
Moving Averages
Trading above the 30- and 50-day moving averages indicates a possible rise.
Please note that the time period and levels of the moving averages are analyzed only for the H1 chart, which differs from the general definition of the classic daily moving averages on the D1 chart.
Bollinger Bands
If the pair declines, the lower band of the indicator at 1.0803 will act as support. In case of an advance, the upper band of the indicator at 1.0840 will act as resistance.
Description of indicators:
• A moving average of a 50-day period determines the current trend by smoothing volatility and noise; marked in yellow on the chart;
• A moving average of a 30-day period determines the current trend by smoothing volatility and noise; marked in green on the chart;
• MACD Indicator (Moving Average Convergence/Divergence) Fast EMA with a 12-day period; Slow EMA with a 26-day period. SMA with a 9-day period;
• Bollinger Bands: 20-day period;
• Non-commercial traders are speculators such as individual traders, hedge funds, and large institutions who use the futures market for speculative purposes and meet certain requirements;
• Long non-commercial positions represent the total number of long positions opened by non-commercial traders;
• Short non-commercial positions represent the total number of short positions opened by non-commercial traders;
• The non-commercial net position is the difference between short and long positions of non-commercial traders.


