


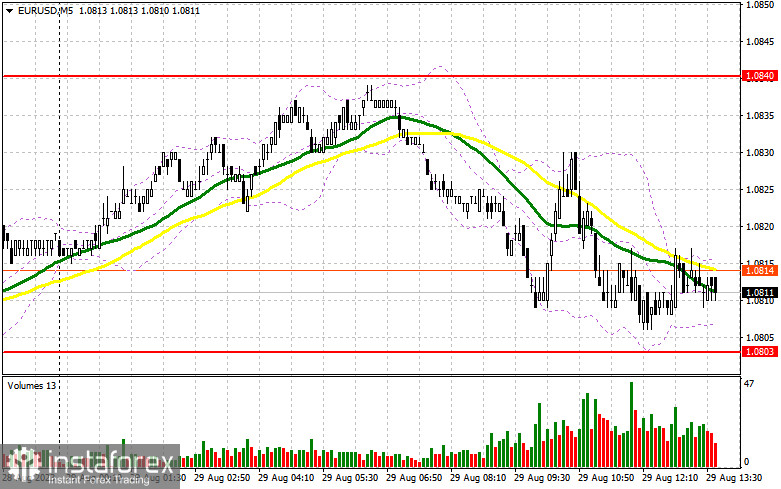
In my morning forecast, I drew attention to the 1.0803 level and advised making decisions to enter the market from it. Let's look at the 5-minute chart and see what happened there. A decline took place, but it never reached a false breakout at that level. Due to the low volatility in the afternoon, the technical picture was not revised.
For opening long positions in EUR/USD:
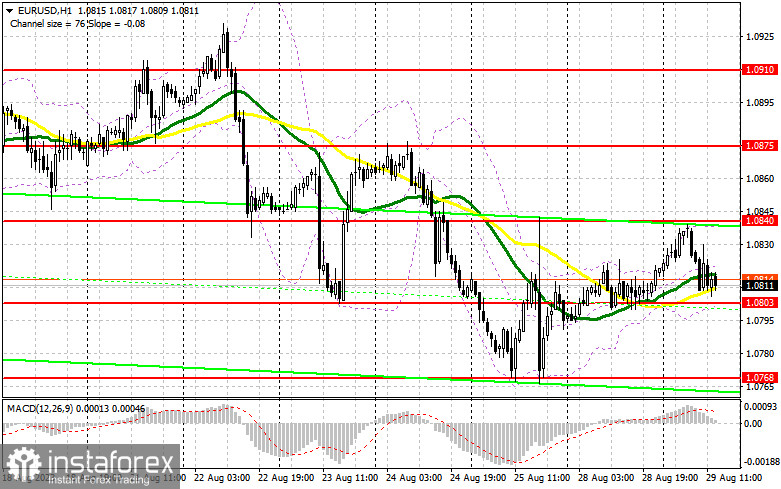
Given that there were no statistics from the eurozone in the first half of the day and data from Germany passed unnoticed by the market, we hope the American session will be livelier. The US Consumer Confidence Index data is expected. A rise in this indicator might weigh on the euro. Paired with a favorable US Housing Price Index, it could push the pair towards the 1.0803 support level. Only after forming a false breakout at this level, like yesterday, can we get a good entry point to buy the euro with the target of rising to a significant resistance of 1.0840, established last Friday. A breakout and a top-down test of this range will strengthen demand for the euro, giving a chance for an upward correction to 1.0875. The ultimate target would be the 1.0910 zone, where I would take profits. If EUR/USD declines and there's no activity at 1.0803 in the second half of the day, a level tested multiple times before, the bearish trend will continue. In this case, only a false breakout around the monthly low of 1.0768 will signal a buy for the euro. I would immediately open long positions on a rebound from 1.0734, aiming for an upward correction of 30-35 points within the day.
For opening short positions in EUR/USD:
Sellers tried but failed to take control. However, buyers will only sometimes dominate the second half of the day. In the current circumstances, the right decision would be to sell around the upper boundary of the sideways channel at 1.0840, which might be approached soon, especially if the US data disappoints, signaling a worsening economy once again. Only a false breakout at 1.0840 will signal a sell and lead to a drop toward the 1.0803 support level, where the moving averages that favor the bulls lie. But only after a breakthrough and stabilization below this range, followed by a bottom-up retest, do I expect another sell signal, paving the way to a minimum of 1.0768, where I anticipate larger buyers. The ultimate target would be the 1.0734 zone, where I would take profits. If EUR/USD moves up during the American session and there are no bears at 1.0840, the bulls will try to re-enter the market. In such a scenario, I would postpone short positions until a new resistance at 1.0875. I would also sell there, but only after an unsuccessful consolidation. I would open short positions immediately on a rebound from the high of 1.0910, aiming for a downward correction of 30-35 points.
Indicator signals:
Moving Averages:
Trading occurs around the 30 and 50-day moving averages, indicating a sideways market trend.
Note: The author considers the period and prices of the moving averages on the H1 hourly chart and differs from the general definition of classic daily moving averages on the D1 daily chart.
Bollinger Bands:
In case of an increase, the upper border of the indicator around 1.0840 will act as resistance.
Description of indicators:
• Moving average (determines the current trend by smoothing out volatility and noise). Period 50. It is marked in yellow on the chart.
• Moving average (determines the current trend by smoothing out volatility and noise). Period 30. It is marked in green on the chart.
• MACD Indicator (Moving Average Convergence/Divergence). Fast EMA period 12. Slow EMA period 26. SMA period 9.
• Bollinger Bands. Period 20.
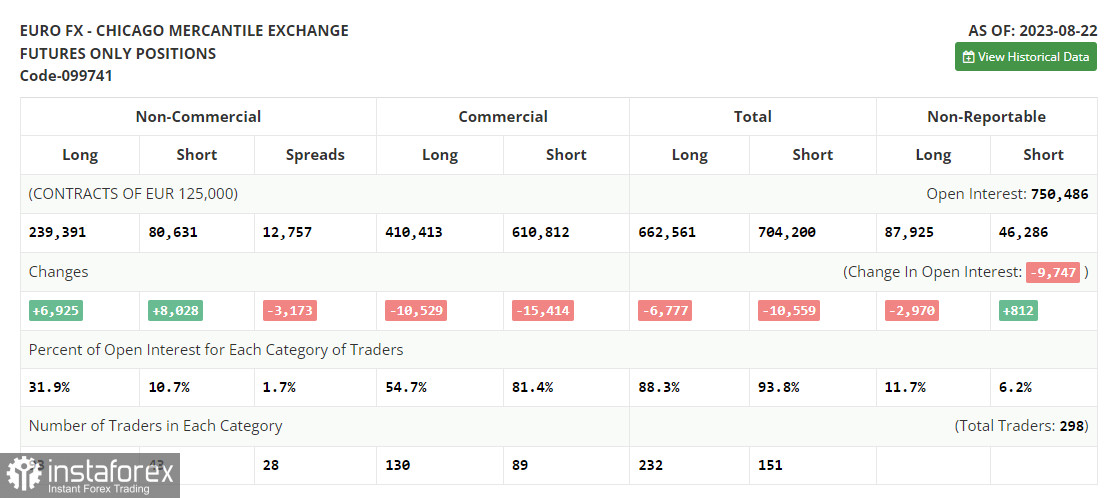
• Non-commercial traders - speculators such as individual traders, hedge funds, and large institutions that use the futures market for speculative purposes and meet certain requirements.
• Non-commercial long positions represent the total open long position of non-commercial traders.
• Non-commercial short positions represent the total open short positions of non-commercial traders.
• The total non-commercial net position is the difference between non-commercial traders' short and long positions.


