


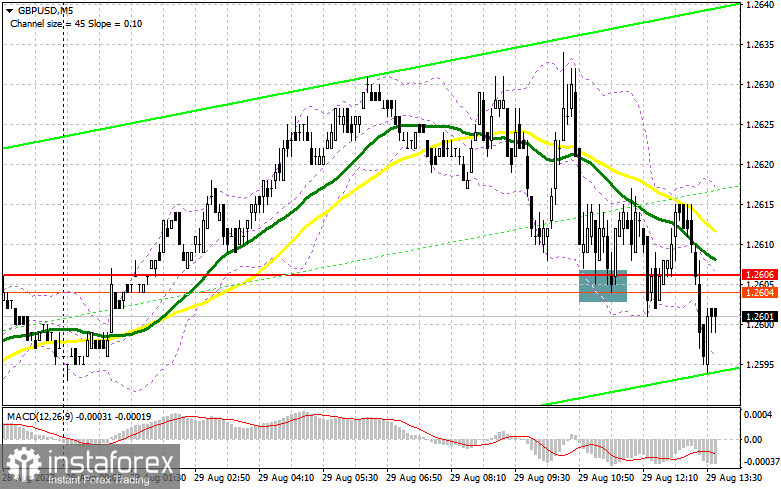
I focused on the 1.2606 level in my morning forecast and recommended making entry decisions based on it. Let's examine the 5-minute chart to see what transpired there. The decline and the formation of a false breakout at this level provided an excellent entry point for buying. However, as seen on the chart, the pound never fully recovered. The technical outlook for the latter part of the day was subsequently revised.
For entering long positions on GBP/USD:
The pound was aggressively sold in the first half of the day. Given that we haven't reached the previous week's high, there might be significant pressure on the pair later in the day. Positive US Consumer Confidence data and the Housing Price Index could trigger further selling, so the only support might be around 1.2573. Only after a false breakout at this level can we consider buying the pound with a recovery target of 1.2599. A breakout and subsequent top-down test of this range provides an additional buying signal, strengthening the pound's position and paving the way to a resistance of 1.2632, which was formed in the first half of the day. If it surpasses this range, a surge towards 1.2659 can be anticipated, where I plan to take profits.
When GBP/USD falls, and there are no buyers at 1.2573, the pressure on the pair might increase, leading to further selling near the monthly low. If this happens, I'll defer long entries until 1.2548. Purchases there will only be based on a false breakout. Opening long positions on GBP/USD immediately for a rebound from 1.2523 to correct 30-35 points within a day is possible.
For entering short positions on GBP/USD:
The bears have made their presence felt. After successfully breaking below 1.2606, their next target is 1.2572. The optimal scenario for opening short positions would be a failure to consolidate above 1.2599. A return to this level might occur during the release of US data, providing an excellent entry point with the objective of a decline and a support test at 1.2573. A breach and subsequent bottom-up test of this range would provide an entry point for selling, targeting an updated 1.2548, strengthening the sellers' market presence. The subsequent target would be the 1.2523 area, where I plan to take profits. When GBP/USD rises, and there are no bears at 1.2599, the bulls may re-enter the market. In such a case, only a false breakout near the next resistance at 1.2632 would provide a short entry point. If there's no activity, I recommend selling GBP/USD from 1.2659, expecting a 30-35 point intraday bounce back down.
Indicator signals:
Moving Averages:
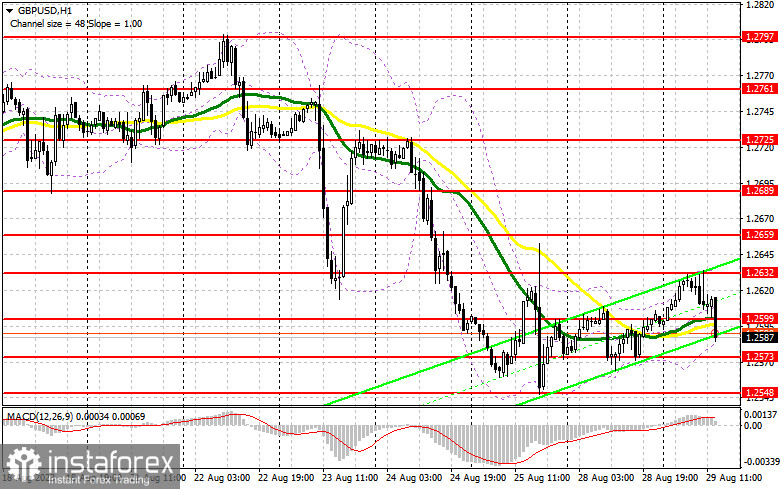
Trading occurs around the 30 and 50-day moving averages, indicating a lateral market trend.
Note: The author considers the period and prices of the moving averages on the hourly H1 chart and differs from the general definition of classic daily moving averages on the D1 daily chart.
Bollinger Bands:
In case of a decline, the lower boundary of the indicator will act as support, around 1.2585.
Description of indicators:
• Moving average: determines the current trend by smoothing out volatility and noise. 50-period. Marked in yellow on the chart.
• Moving average: determines the current trend by smoothing out volatility and noise. 30-period. Marked in green on the chart.
• MACD Indicator (Moving Average Convergence/Divergence): Fast EMA period 12. Slow EMA period 26. SMA period 9.
• Bollinger Bands: 20-period.
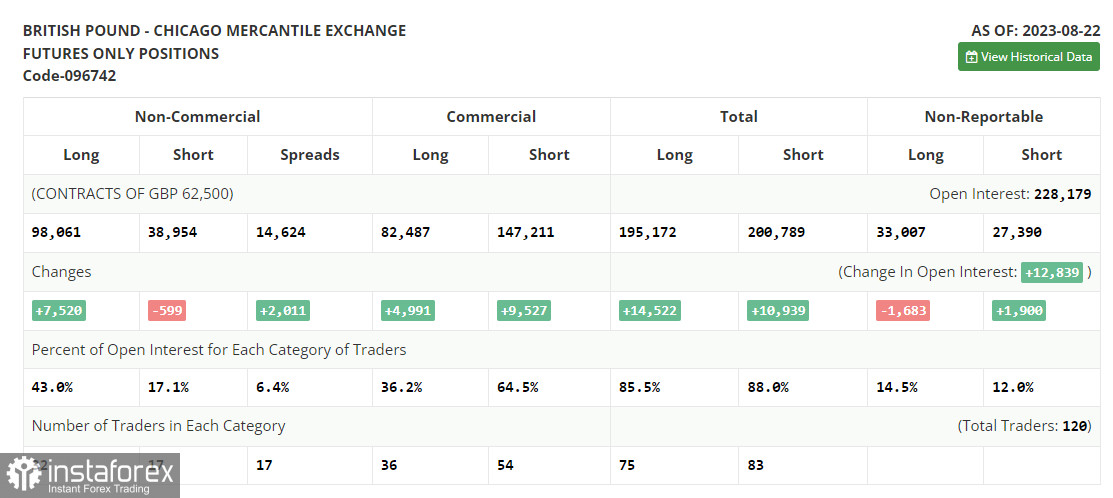
• Non-commercial traders: speculators, such as individual traders, hedge funds, and large institutions, that use the futures market for speculative purposes and meet certain requirements.
• Non-commercial long positions represent the total open long position of non-commercial traders.
• Non-commercial short positions represent the total open short positions of non-commercial traders.
• The total non-commercial net position is the difference between non-commercial traders' short and long positions.


