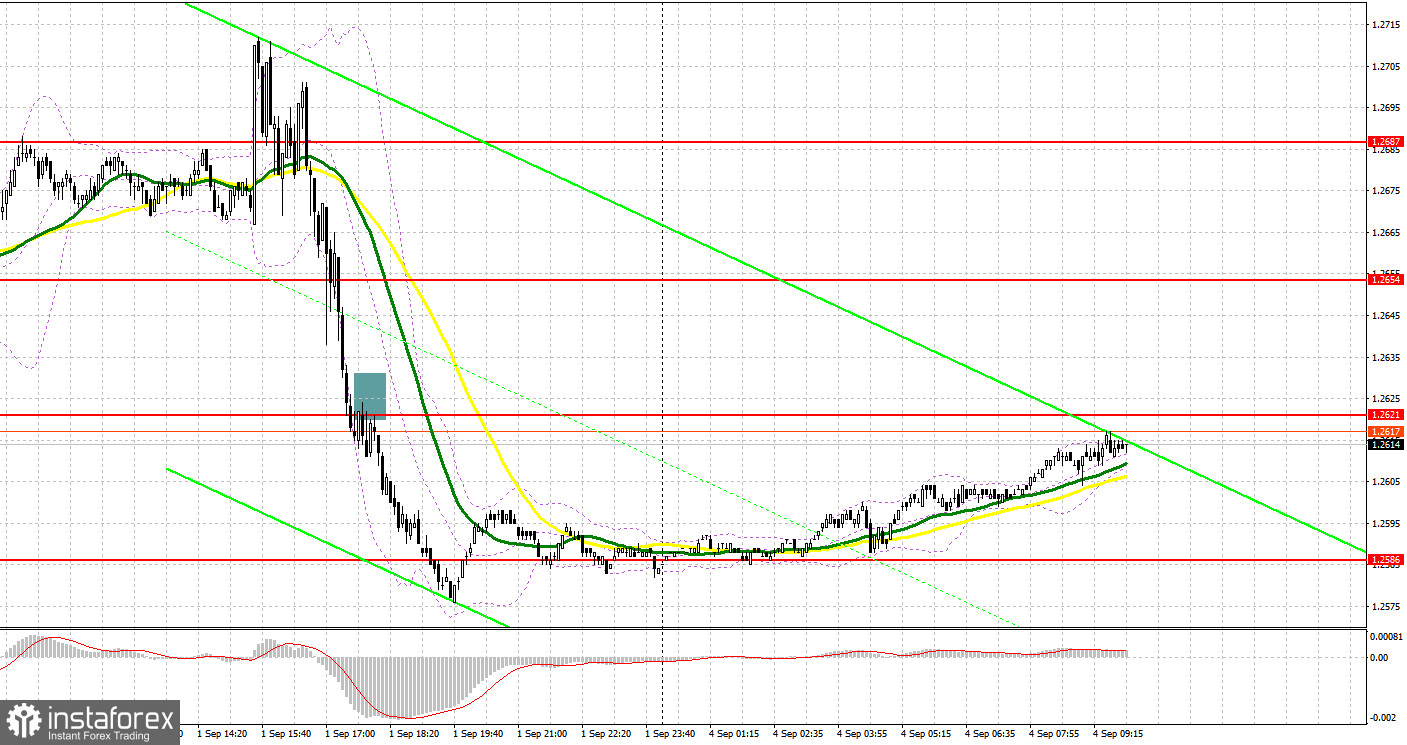
On Friday, the pair formed several entry signals. Let's have a look at what happened on the 5-minute chart. In my morning review, I mentioned the level of 1.2654 as a possible entry point. The pair managed to break through this level but after its retest, bulls regained control of this range. So, I couldn't get an entry point into short positions. In the second half of the day, a breakout and a retest of the 1.2621 level created a nice entry point for selling the pound. As a result, the price declined to 1.2586.

For long positions on GBP/USD:
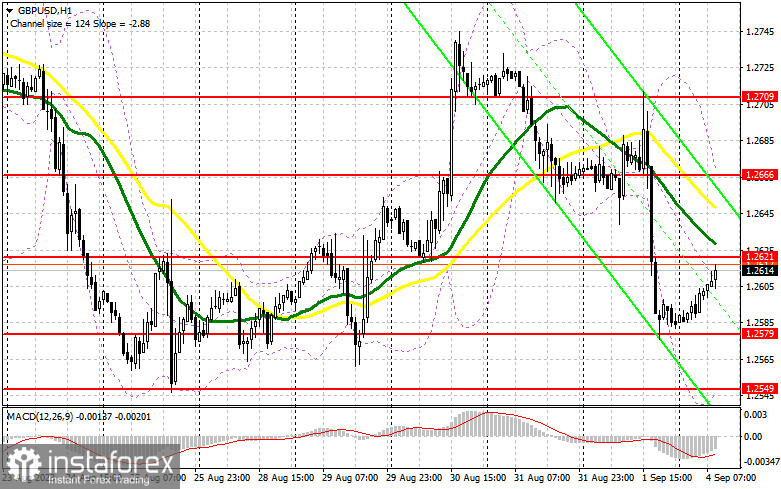
The robust US labor market has led to a further decline in the pound and a strengthening of the US dollar. Given today's absence of any reports from the UK, bulls will have an opportunity to recover. The optimal action point is near the immediate support level at 1.2579. A false breakout of this level would serve as a buy signal, aiming for a recovery towards 1.2621, where the moving averages are currently aligned in favor of sellers. A breakout and consolidation above this range will bolster the buyers' confidence, maintaining prospects towards 1.2666. The ultimate target will be the 1.2709 area where I intend to take profit. If the pair drops to 1.2579 without significant buying activity, the pressure on the pound will intensify, raising the possibility of a broader decline. In this scenario, only a defense of 1.2549 and its false breakout will signal a buying opportunity. I plan to buy GBP/USD right after a rebound from the 1.2520 low, keeping in mind an intraday correction of 30-35 pips.
For short positions on GBP/USD:
For sellers, it is crucial to defend the immediate resistance at 1.2621 where the moving averages are located. I will act here only after an unsuccessful consolidation signaling a selling opportunity with the downward target at 1.2579. A breakout and a subsequent upward retest of this range will deal a significant blow to bullish positions, paving the way for a decline to the monthly low around 1.2549. The ultimate target remains the 1.2520 level where I will be taking profit. If GBP/USD rallies and there is no significant action at 1.2621, buyers might re-enter the market. In this case, I will postpone selling the pair until a false breakout at 1.2666. If the price does not decline at this point, I will sell the pound directly on a bounce from 1.2709, anticipating an intraday correction of 30-35 pips.

COT report
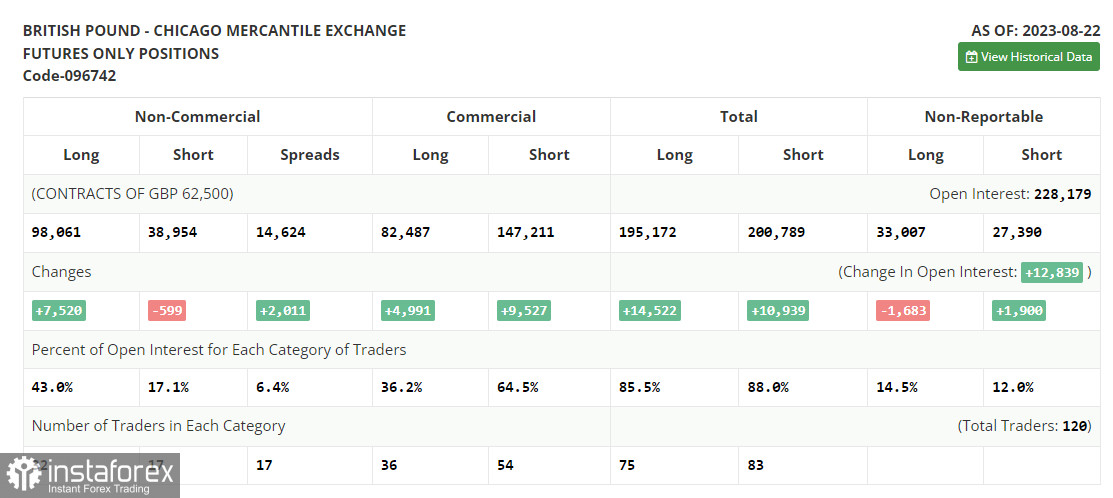
The Commitments of Traders report for August 22 indicates a rise in long positions and a drop in the short ones. Traders continued to accumulate long positions as the pound fell following recent positive GDP data from the UK. However, the whole picture was overshadowed by the PMI data. A decrease in the indicator, along with a speech by Federal Reserve Chairman Jerome Powell indicating that the key rate is likely to be raised again, made the pair renew its monthly lows. However, buyers quickly took advantage of this: the lower the pound, the more attractive it becomes for medium-term purchases. The difference in policies of the central banks will continue to positively impact GBP/USD. The latest COT report indicates that non-commercial long positions increased by 7,520 to 98,061, while non-commercial short positions decreased by 599 to 38,954. As a result, the spread between long and short positions jumped by 2,011. The weekly closing price went up to 1.2741 from the previous value of 1.2708.

Indicator signals:
Moving Averages
Trading below the 30- and 50-day moving averages indicates a possible decline in the pair.
Please note that the time period and levels of the moving averages are analyzed only for the H1 chart, which differs from the general definition of the classic daily moving averages on the D1 chart.
Bollinger Bands
If the pair declines, the lower band of the indicator at 1.2549 will act as support.
Description of indicators:
• A moving average of a 50-day period determines the current trend by smoothing volatility and noise; marked in yellow on the chart;
• A moving average of a 30-day period determines the current trend by smoothing volatility and noise; marked in green on the chart;
• MACD Indicator (Moving Average Convergence/Divergence) Fast EMA with a 12-day period; Slow EMA with a 26-day period. SMA with a 9-day period;
• Bollinger Bands: 20-day period;
• Non-commercial traders are speculators such as individual traders, hedge funds, and large institutions who use the futures market for speculative purposes and meet certain requirements;
• Long non-commercial positions represent the total number of long positions opened by non-commercial traders;
• Short non-commercial positions represent the total number of short positions opened by non-commercial traders;
• The non-commercial net position is the difference between short and long positions of non-commercial traders.


