


GBP Bulls Retrace as Market Enters Consolidation
Key Takeaways:
- GBP/USD retraces 50% of recent downtrend, signaling bullish pullback.
- Technical indicators, including candlestick patterns and moving averages, offer mixed signals, reflecting market indecision.
- Sentiment scores lean towards bullish sentiment, but traders remain cautious amid consolidation.
The GBP/USD pair displays signs of retracement amidst market consolidation, with bullish momentum driving the currency pair towards key resistance levels. Traders scrutinize technical indicators and sentiment scores for insights into potential bullish or bearish scenarios.
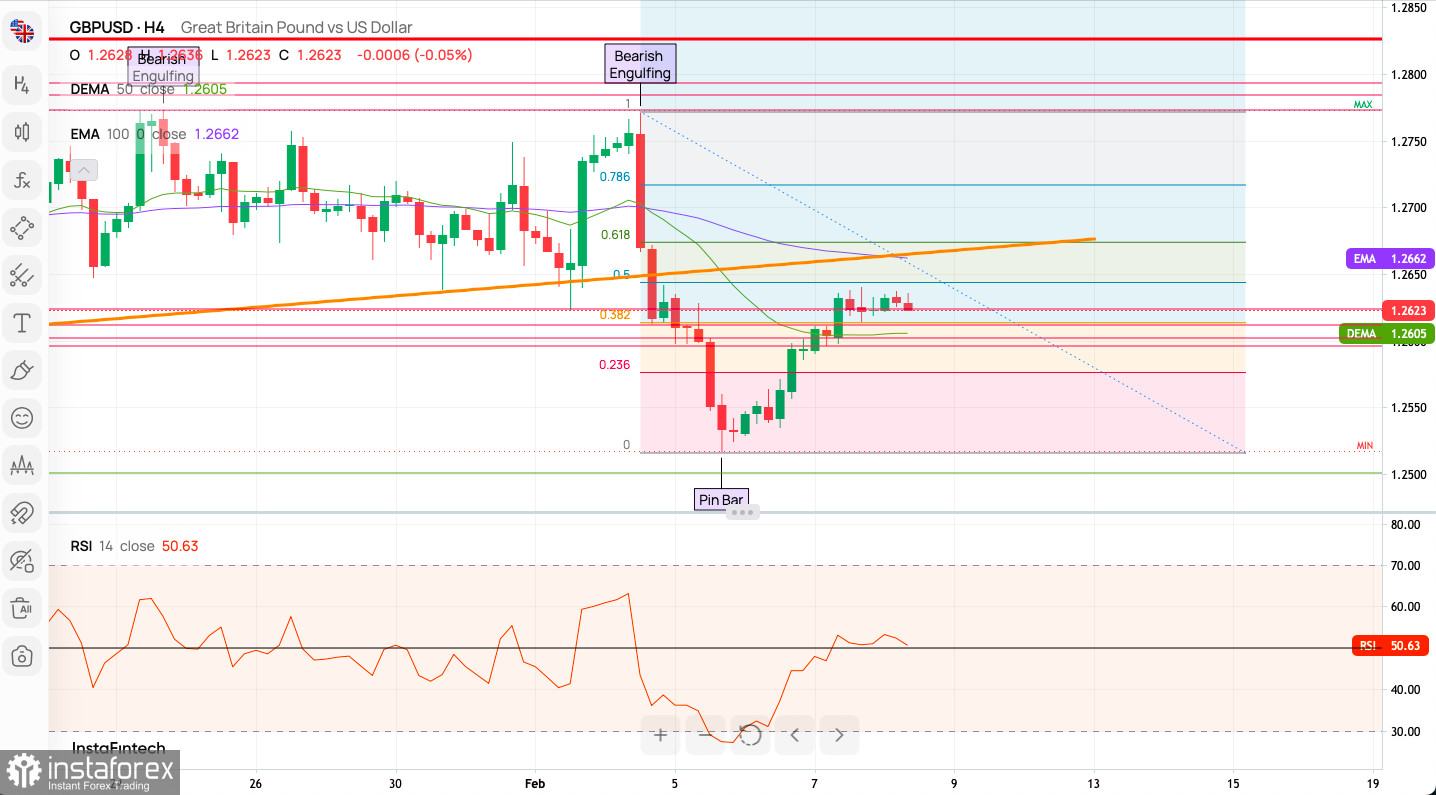
 GBP/USD pair retraces 50% of the last downward wave, consolidating around the short-term supply zone between 1.2625 - 1.2598. Bullish momentum persists, but lacks strength, potentially leading to another upswing towards the 61% Fibonacci retracement level at 1.2675. Immediate intraday support lies at 1.2612.
Candlestick Patterns:
A 'Bearish Engulfing' pattern emerges on the H4 chart, indicating potential bearish reversal. Conversely, a 'Pin Bar' candlestick at the downtrend's bottom suggests a bullish reversal signal, reflecting market uncertainty.
Moving Averages:
The price fluctuates between the 50-period Double Exponential Moving Average (DEMA) and the 100-period Exponential Moving Average (EMA). While the DEMA surpasses the EMA, signaling a bullish crossover, the price remains below the DEMA, indicating underlying bearish pressure.
Fibonacci Retracement Levels:
Fibonacci retracement levels highlight key areas of support and resistance. The price hovers around the 0.5 level, a critical juncture, having surpassed the 0.382 level. These levels often influence market sentiment and trading decisions.
Support and Resistance:
Distinct support and resistance levels guide market movements. Immediate resistance lies near 1.2625, while significant support rests near 1.2605. Traders closely monitor these levels for potential breakout or reversal opportunities.
Relative Strength Index (RSI):
The RSI stands at 50.63, indicating neutrality in market conditions. Neither overbought nor oversold, this suggests balanced momentum between bulls and bears.
Intraday Indicator Signals:
Technical indicators offer mixed signals, with 11 out of 23 indicators suggesting a Buy, while 3 signal a Sell, and 9 remain Neutral. Similarly, moving averages reflect a predominantly bullish sentiment.
 #sebastianseliga


