


Analyzing ETH/USD Technicals: A Deep Dive into Market Trends
Unlocking Ethereum's Momentum
Crypto enthusiasts, pay heed: Ethereum's journey continues to captivate as its staking narrative gains traction. Recent data reveals a significant surge, with a quarter of the Ethereum supply now staked, reflecting the community's unwavering confidence.
Key Takeaways:
- Staking Surge: Ethereum's staking landscape is flourishing, with approximately 30 million ETH staked, valued at a staggering $73 billion.
- Strong Support: The network boasts over 940,000 validators, further solidifying its foundation.
- Deflationary Dynamics: With a supply decrease since the Merge in September 2022, Ethereum's inflation rate stands at -0.57% per year, with notable daily burns.

Technical Market Outlook:
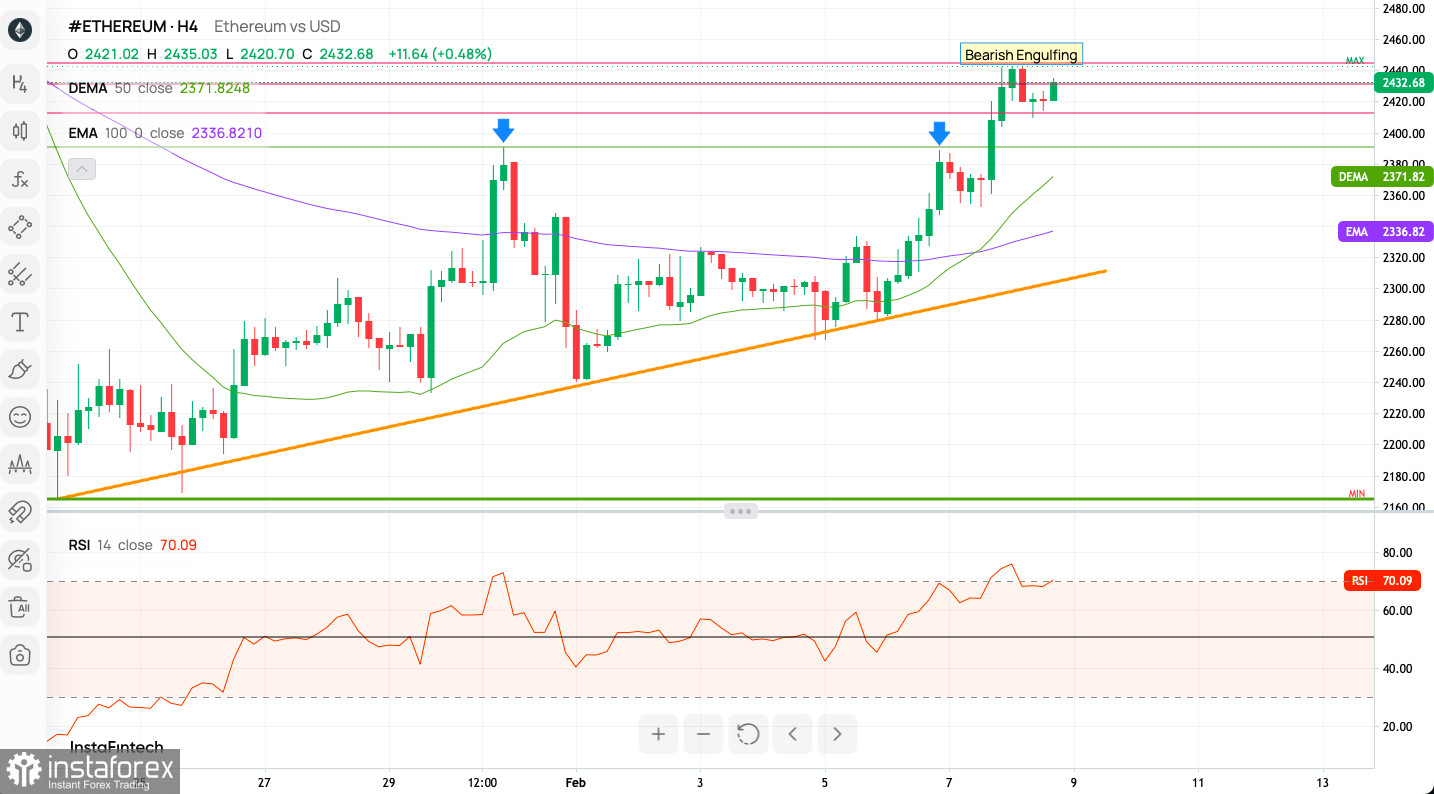
The ETH/USD pair's recent performance underscores bullish momentum, despite challenges. With the Double Top pattern nullified, bulls maintain control, eyeing key resistance levels.
Technical Insights:
Understanding Price Dynamics
- Candlestick Patterns: A 'Bearish Engulfing' pattern emerges, suggesting a potential reversal amidst prior bullish momentum.
- Moving Averages: Ethereum's price surpasses both the 50-period DEMA and the 100-period EMA, affirming a bullish trajectory.
- Trend Lines: An ascending trendline offers crucial support, indicating sustained buyer interest.
- Resistance Levels: The $2440 threshold presents formidable resistance, tested but unbroken in recent sessions.
- Relative Strength Index (RSI): RSI hovers close to overbought territory, signaling a possible impending pullback or consolidation.
Intraday 1H Indicator Signals:
- Technical indicators lean towards a Sell sentiment, albeit with notable Buy signals and Neutral indicators.
- Moving averages predominantly signal a Buy sentiment, with a minority suggesting Sell.
Sentiment Scoreboard:
Bulls in Command
The sentiment remains overwhelmingly bullish, with recent weeks witnessing a surge in bullish sentiment, reflecting investor optimism.
Weekly Pivot Points:
Charting Price Dynamics
- WR3 - $2,414
- WR2 - $2,358
- WR1 - $2,337
- Weekly Pivot - $2,301
- WS1 - $2,281
- WS2 - $2,245
- WS3 - $2,204
Trading Insights:
For Bulls and Bears
Bullish Scenario:
- Sustained position above DEMA and EMA, coupled with controlled RSI, could propel ETH towards breaking $2440 resistance.
- A breakthrough may signify an extended uptrend, opening avenues for further price exploration.
Bearish Scenario:
- The emergence of the 'Bearish Engulfing' pattern hints at a possible reversal, especially if followed by a drop below DEMA.
- A breach of the ascending trendline could validate the bearish outlook, with potential support zones near EMA levels.
In a market driven by volatility, staying abreast of technical signals and sentiment trends is paramount. As ETH/USD charts its course, traders must remain vigilant, adapting strategies to capitalize on evolving market dynamics.


