EUR/USD

Higher Timeframes
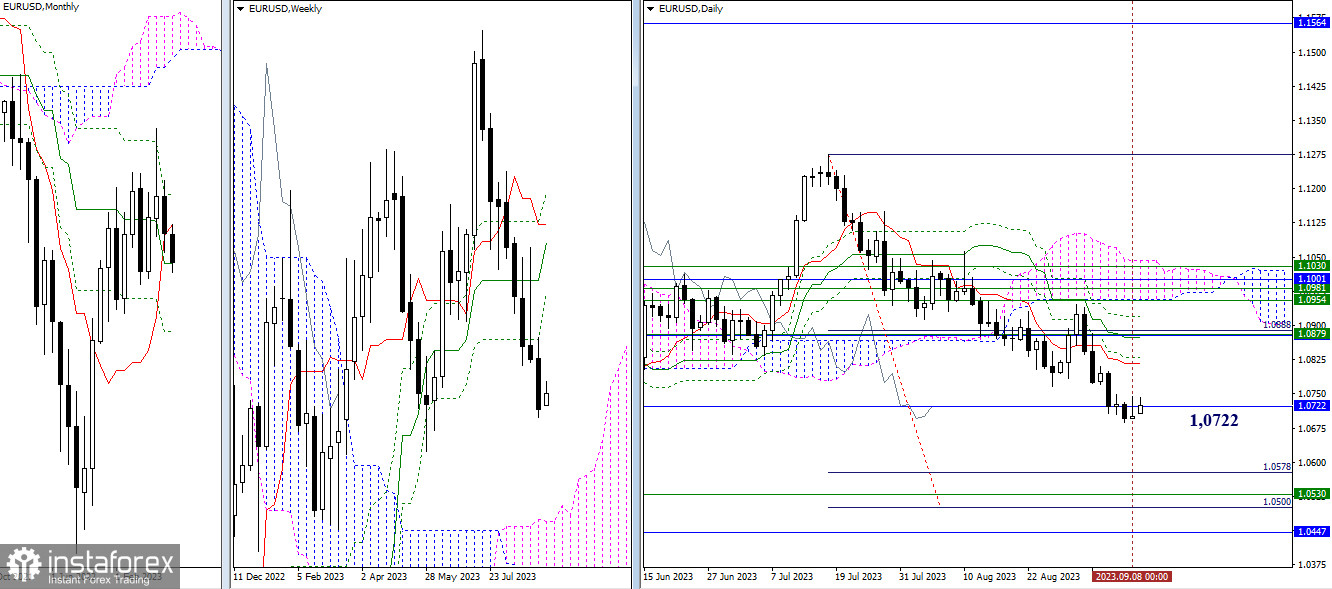
Last week, bearish players managed to continue the decline and ended the week on an optimistic note. However, there is a circumstance that weakens the situation as bearish players descended into the area of attraction and influence of the monthly medium-term trend (1.0722). The outcome of this interaction may determine the further course of events. Breaking through the support and further decline will open up opportunities for bearish players to test the broad support zone. This zone is currently defined by the daily target for breaking the Ichimoku cloud (1.0500 – 1.0578), the upper boundary of the weekly cloud (1.0530), and the final level of the monthly Ichimoku cross (1.0447).
If the strength of the monthly medium-term trend support (1.0722) can serve as a basis to halt the current decline and bring bullish activity back to the market, the following movement scenarios are possible. In the current conditions, bullish players may be content with consolidation, continuing the decline after a pause, or they may seek to establish a rebound from the support at 1.0722, aiming for a significant shift in the balance of power. The nearest resistance at present is the daily short-term trend (1.0817), and then the crucial level of 1.0875-79 (daily medium-term trend + monthly short-term trend + weekly Fibonacci Kijun).

H4 – H1
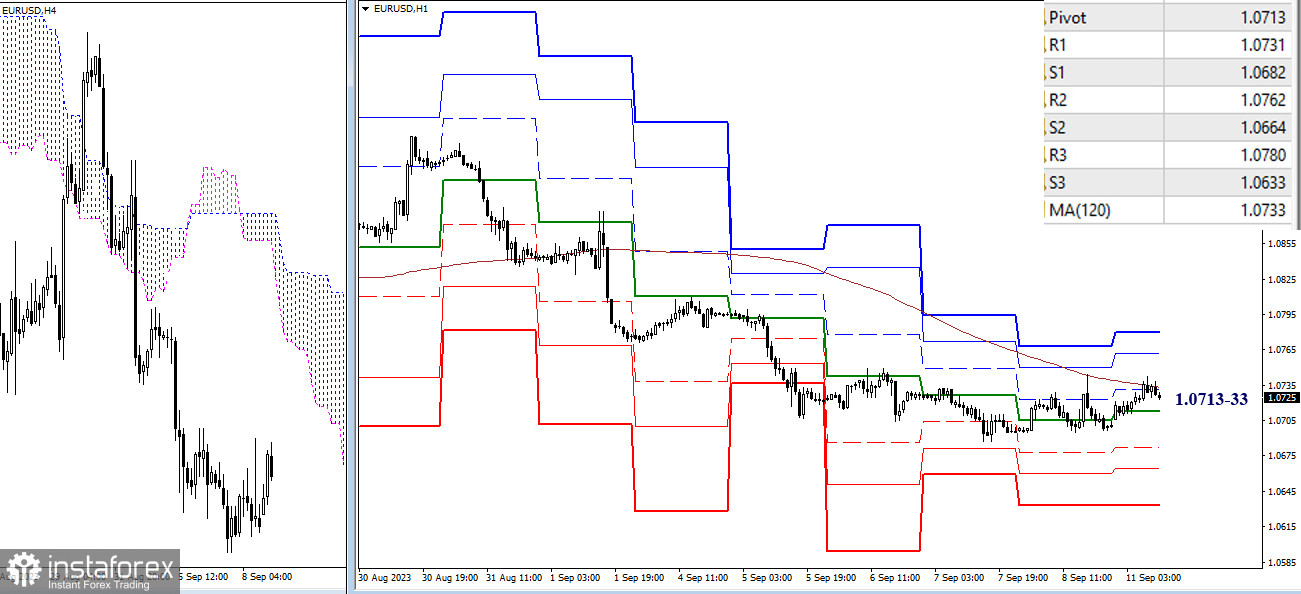
On the lower timeframes, the situation is close to shifting in favor of bullish players. Currently, there is a struggle for the key level—the weekly long-term trend (1.0733). Additional bullish targets within the day can be noted at 1.0762 – 1.0780 (resistance levels of classic pivot points). In case of correction completion and continuation of the current downward trend, the support levels of classic pivot points within the day will serve as bearish targets (1.0682 – 1.0664 – 1.0633).
***
GBP/USD

Higher Timeframes
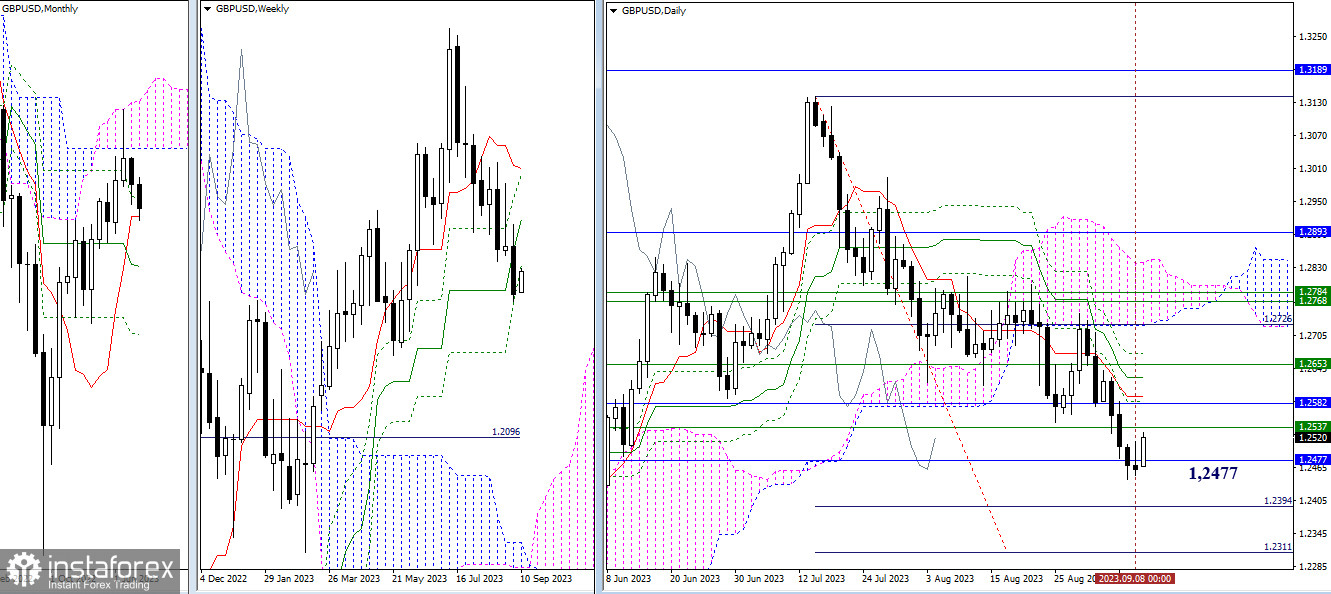
Last week, the pair reached the monthly short-term trend (1.2477) and began testing it. The next bearish target at the moment is the target for breaking the daily Ichimoku cloud (1.2311 – 1.2394). The strength of the encountered support may lead to a return of bullish players to the market in the near future. The recovery of bullish positions may primarily encounter resistance at the Fibonacci Kijun levels of the week (1.2537) and the month (1.2582). Further attention of bullish players will be directed towards crossing the levels of the daily Ichimoku cross, which are currently located at 1.2594 (Tenkan) and 1.2629 (Kijun).

H4 – H1
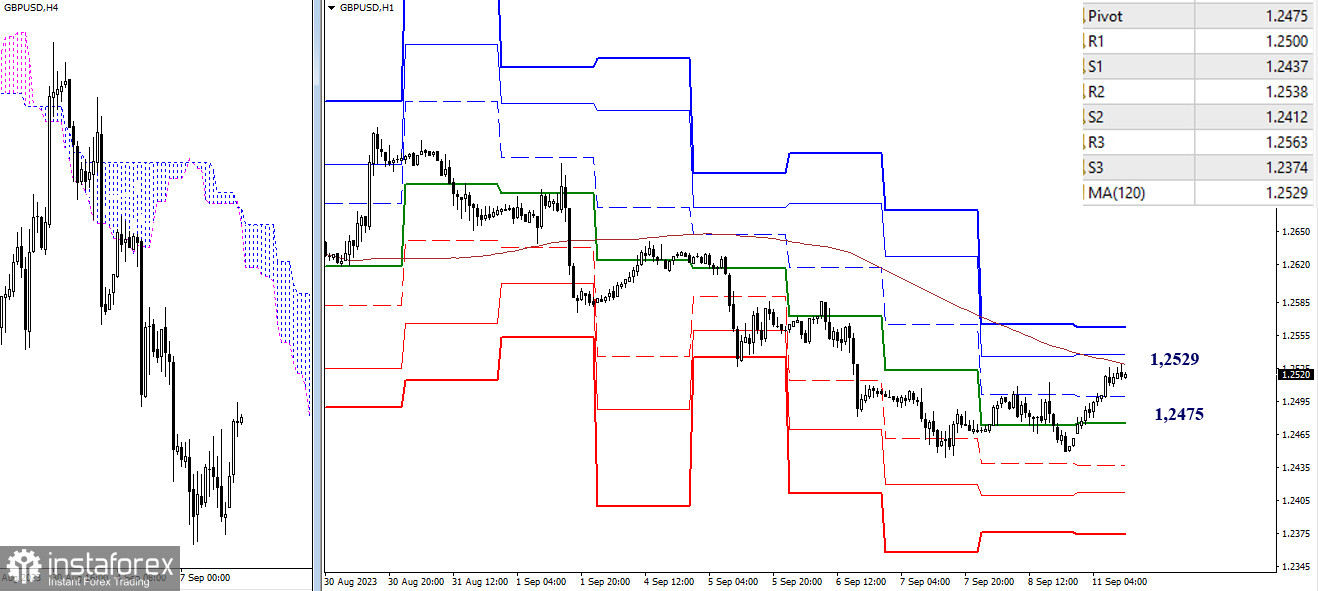
At the moment, bullish players are ready to compete for control of the weekly long-term trend (1.2529). This level is responsible for the current balance of power on the lower timeframes. Consolidation above it and a reversal of the moving average will help strengthen bullish sentiment. The benchmarks for further ascent within the day will be 1.2538 – 1.2563 (classic pivot points). In case of a decline, support can be provided by any of the classic pivot points located below the current price: 1.2500 – 1.2475 – 1.2437 – 1.2412 – 1.2374.
***
The technical analysis of the situation uses:
Higher timeframes - Ichimoku Kinko Hyo (9.26.52) + Fibo Kijun levels
Lower timeframes - H1 - Pivot Points (classic) + Moving Average 120 (weekly long-term trend)


