


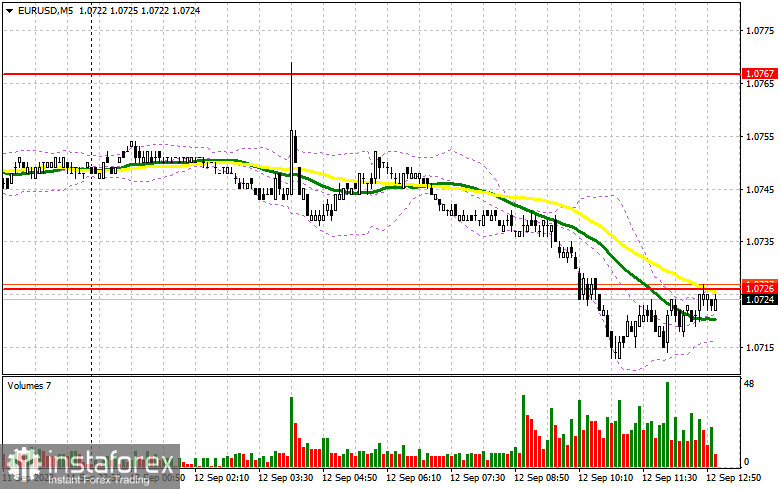
In my morning forecast, I pointed out the level of 1.0726 and recommended making entry decisions based on it. Let's look at the 5-minute chart and analyze what happened there. The pair did experience a drop but never reached the normal false breakout formation. Instead, it continued to decline. The technical picture changed completely in the second half of the day.
To open long positions on EUR/USD, the following is required:
The ZEW figures on sentiment and conditions in the German and Eurozone business environment led to a decline in the euro in the first half of the day since the data, as expected, turned out to be even worse than economists' forecasts. Considering the recent incoming statistics, the euro's decline was not surprising. During the American session, there is nothing except the NFIB Small Business Optimism Index, so I do not exclude the possibility of continued pressure on the pair ahead of tomorrow's important statistics. For this reason, I will only act on the decline near the new support level of 1.0700, where buyers should come into play. A false breakout formation at this level will confirm an appropriate entry point for long positions with the recovery target towards 1.0736, where the moving averages, playing on the sellers' side, intersect. Breaking through and testing this range from top to bottom will strengthen the demand for the euro, giving a chance for a surge to 1.0767. The ultimate target will be the area of 1.0798, where I will take profit. With a decline in EUR/USD and the absence of activity at 1.0700, the bears will take full control of the market. In such a scenario, only a false breakout formation around 1.0665 will signal a buy signal for the euro. I will open long positions after a bounce from 1.0637 with the goal of an intraday upward correction of 30-35 points.
To open short positions on EUR/USD, the following is required:
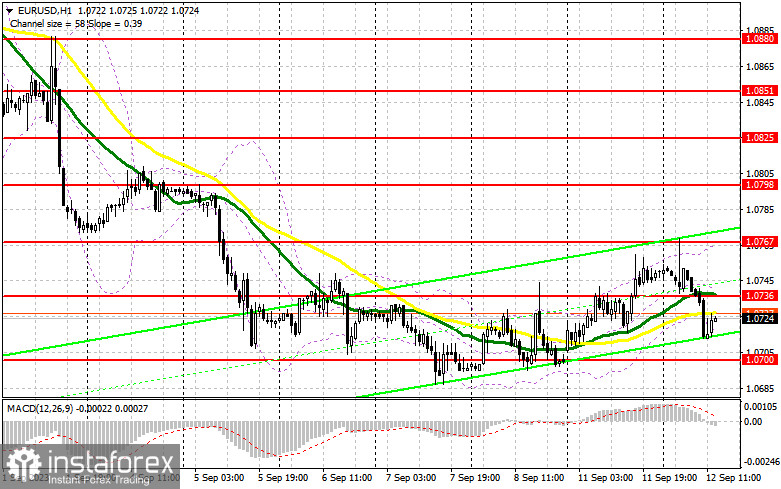
Sellers have achieved a rather significant correction of the euro, and it is unlikely that we will break out of the sideways channel of 1.0700-1.0767 soon. In case of growth in the pair in the second half of the day, bears will have to defend the new resistance at 1.0736. A false breakout at this level will signal a sell-off, opening the way to the support area of 1.0700. After breaking through and consolidating below this range, as well as a retest from bottom to top, I expect to get another signal with the goal of reaching 1.0665, indicating a resumption of the medium-term bearish trend. The ultimate target will be the area of 1.0637, where I will take profit. In the event of upward movement in EUR/USD during the American session and the absence of bears at 1.0736, the balance will be restored, and bulls will have a chance to build an upward correction. In such a scenario, I will postpone short positions until the new resistance at 1.0767. Selling there is also possible, but only after an unsuccessful consolidation. I will open short positions immediately on the rebound from 1.0798 with the goal of a downward correction of 30-35 points.
Edit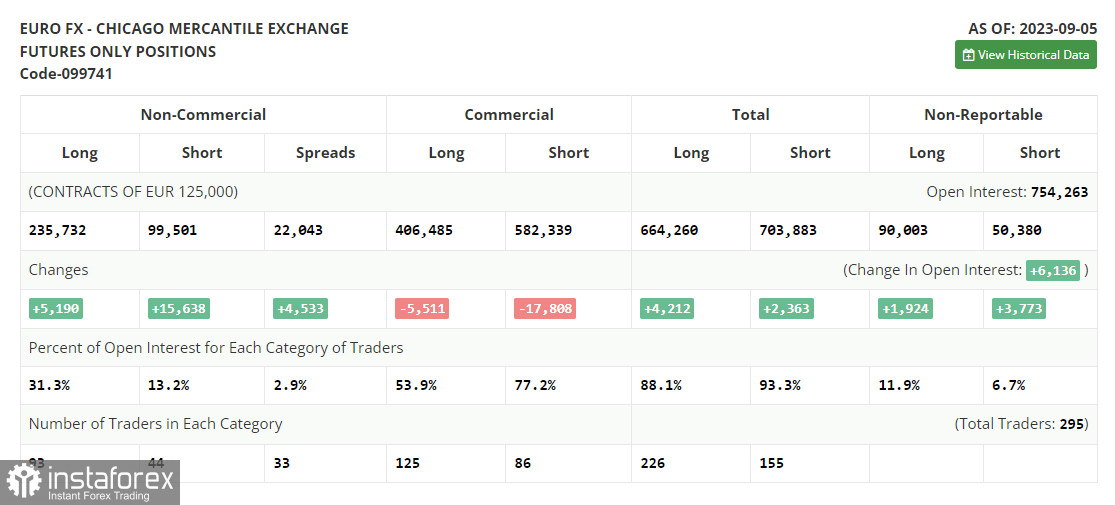
Indicator signals:
Moving averages
Trading is carried out slightly below the 30 and 50-day moving averages, indicating a possible decline in the pair.
Note: The period and prices of moving averages are author-defined on the H1 chart and differ from the classic daily moving averages on the D1 chart.
Bollinger Bands
In the case of growth, the upper boundary of the indicator at around 1.0767 will act as resistance.
Indicator Descriptions:
- Moving Average (an indicator that determines the current trend by smoothing out volatility and noise). Period 50. Marked in yellow on the chart.
- Moving Average (an indicator that determines the current trend by smoothing out volatility and noise). Period 30. Marked in green on the chart.
- MACD Indicator (Moving Average Convergence/Divergence – convergence/divergence of moving averages) Fast EMA period 12. Slow EMA period 26. SMA period 9.
- Bollinger Bands (Bollinger Bands). Period 20.
- Non-commercial traders – speculators, such as individual traders, hedge funds, and large institutions, use the futures market for speculative purposes and meet certain requirements.
- Long non-commercial positions represent the total long open position of non-commercial traders.
- Short non-commercial positions represent the total short open positions of non-commercial traders.
- The total non-commercial net position is the difference between non-commercial traders' short and long positions.


