


EUR/USD Outlook: A Detailed Analysis for February 19, 2024
Exploring Market Dynamics and Technical Patterns
Key Takeaways:
- EUR/USD demonstrates resilience with a bullish pattern underway.
- The currency pair faces resistance, limiting upward movement.
- Market sentiment leans bullish, with a keen eye on upcoming global events.

The EUR/USD currency pair offers a fascinating glimpse into the intertwined world of forex markets and global economic indicators. On February 19, 2024, we notice a pattern of resilience amid various challenges, including resistance zones and significant upcoming economic events. This analysis delves into the technical and fundamental aspects shaping the pair's trajectory.
Morning Brief:
Today, the forex landscape is quiet due to holidays in the USA and Canada, affecting market liquidity. However, the anticipation builds for later in the week with pivotal rate decisions and economic releases on the horizon, including from China, Turkey, and key insights from the FOMC, RBA, and ECB minutes.
Futures for European indices signal a lower opening. Today's macro calendar is bare, compounded by holidays in the USA and Canada, dampening market liquidity. While American futures trade, Wall Street's cash session remains closed, halting share trading.
The week ahead teems with events. Investors await China and Turkey rate decisions, FOMC, RBA, ECB minutes, and Europe's preliminary PMI indices alongside Nvidia's results.
Key Events This Week:
Tuesday
- RBA Minutes (01:30)
- People's Bank of China rate decision (02:15)
- Canada CPI inflation (02:30)
Wednesday
- FOMC Minutes (20:00)
- Nvidia results (22:10)
Thursday
- France, Germany, UK preliminary PMIs (09:15 - 10:30)
- CBRT rate decision (12:00)
- ECB Minutes (13:30)
- Canada retail sales (14:30)
- USA preliminary PMIs (15:45)
Friday
- Germany GDP (08:00)
Technical Outlook:
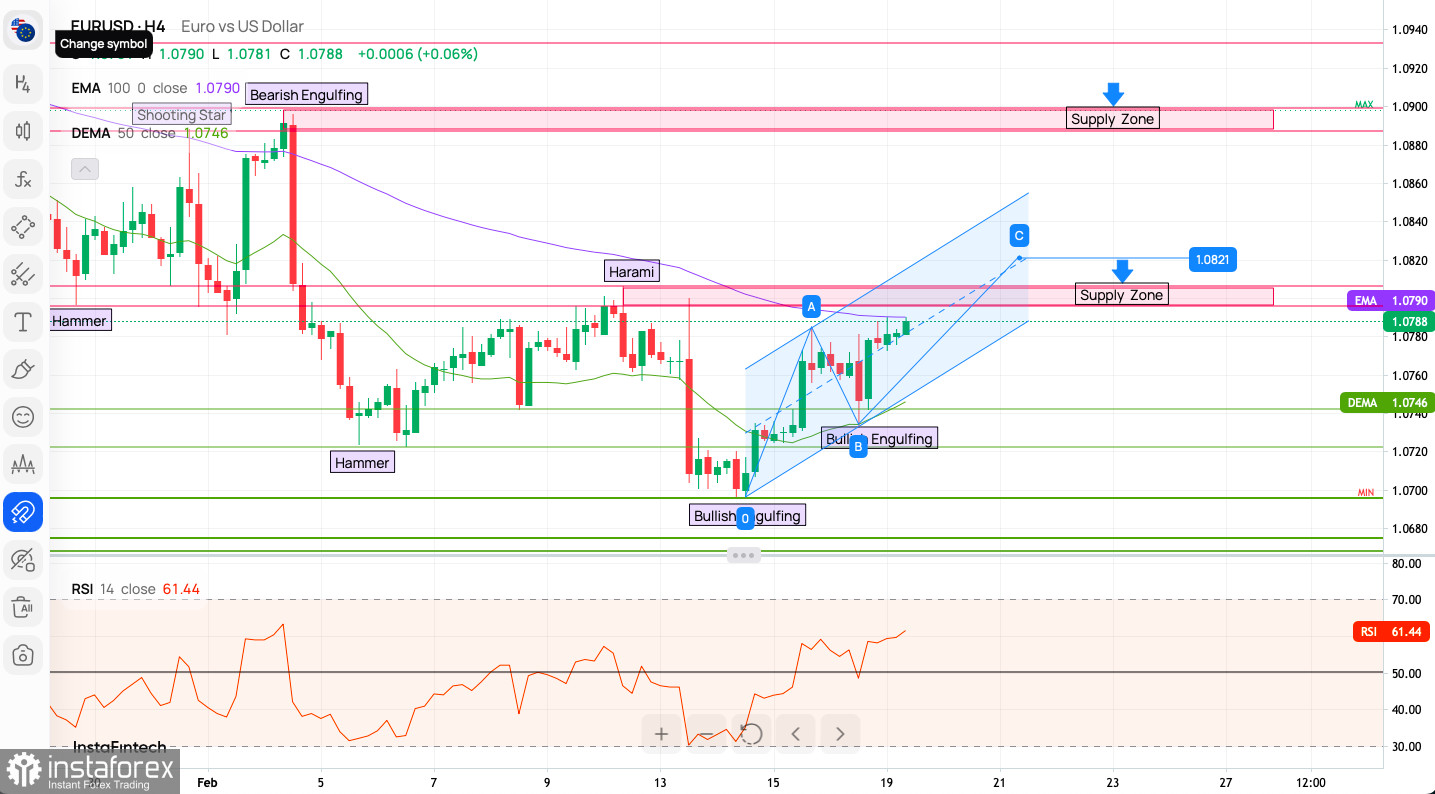
EUR/USD finds support at 1.0696, attempting a rebound. Resistance at 1.0795 and 1.0806 forms a supply zone. The 100 MA at 1.0790 adds to resistance. Support lies at 1.0742 and 1.0735. Bulls currently dominate, executing an ABC pattern towards 1.0821.
Candlestick Patterns and Price Action:
There are multiple candlestick patterns labeled on the chart such as 'Hammer', 'Shooting Star', 'Harami', 'Bearish Engulfing', and 'Bullish Engulfing'. These are indicative of potential market reversals or continuation depending on their position in the trend.
- Hammers suggest a potential reversal upward after a downtrend.
- Shooting Stars suggest a potential reversal downward after an uptrend.
- Harami patterns suggest a potential for trend reversal or consolidation.
- Engulfing patterns indicate strong buying or selling momentum depending on whether they are bullish or bearish.
Trend Lines and Channels:
The chart shows an upward channel, suggesting a short-term bullish trend within which the price is oscillating.
Support/Resistance Zones:
Two supply zones are marked, one around 1.0821 and a broader one extending above this level. These zones are typically where selling interest is concentrated and may act as resistance.
Moving Averages:
- The EMA (Exponential Moving Average) 100 is above the current price, suggesting it could act as dynamic resistance.
- The DEMA (Double Exponential Moving Average) 50 is below the current price, which could act as dynamic support.
Relative Strength Index (RSI):
The RSI is around 61.44, which is above the midpoint of 50 but below the overbought threshold of 70. This indicates some bullish momentum but not to the extent that the market is considered overbought.
H1 Intraday Indicators:
- 15 Buy, 2 Sell signals, 5 Neutral
- All 18 moving averages indicate Buy.
Sentiment Score: Bullish sentiment prevails (58% vs. 42%). Last week mirrored bullishness (56% vs. 44%). Recent sentiment remains neutral (50% vs. 50%).
Weekly Pivot Points:
Above Weekly Pivot (1.07824)
- WR1 (1.07902): Immediate resistance within the upward channel.
- WR2 (1.07970): Breach may test 1.0821, reinforcing bullish sentiment.
- WR3 (1.08116): Positions for a challenge of upper supply zone.
Below Weekly Pivot (1.07824)
- WS1 (1.07756): Initial support, breach suggests bearish pressure.
- WS2 (1.07678): Pivot support above DEMA 50, significant if breached.
- WS3 (1.07568): Suggests bearish outlook, potential exit from upward channel.
Key Observations:
- Tight weekly pivot clustering suggests narrow trading range, hinting at potential breakouts.
- Pivot levels near current price and technical indicators imply critical roles in market behavior.
- RSI at 61.44, neither overbought nor oversold, allows flexibility in price movement.
Bullish Scenario:
- If the current price maintains its position above the DEMA 50 and within the upward channel, and if the RSI remains above 50 without reaching overbought levels, there could be continued bullish momentum. A break above the first supply zone at 1.0821 could lead to further gains, potentially testing the higher supply zone.
Bearish Scenario:
- If the price action shows rejection at the supply zone around 1.0821 or if a bearish candlestick pattern forms, it could signal a bearish reversal. Additionally, if the price falls below the DEMA 50 and exits the upward channel, it may indicate a shift to a bearish trend. A significant drop in the RSI below 50 would also support the bearish outlook.
Useful Links
Important Notice
The begginers in forex trading need to be very careful when making decisions about entering the market. Before the release of important reports, it is best to stay out of the market to avoid being caught in sharp market fluctuations due to increased volatility. If you decide to trade during the news release, then always place stop orders to minimize losses.
Without placing stop orders, you can very quickly lose your entire deposit, especially if you do not use money management and trade large volumes. For successful trading, you need to have a clear trading plan and stay focues and disciplined. Spontaneous trading decision based on the current market situation is an inherently losing strategy for a scalper or daytrader.


