


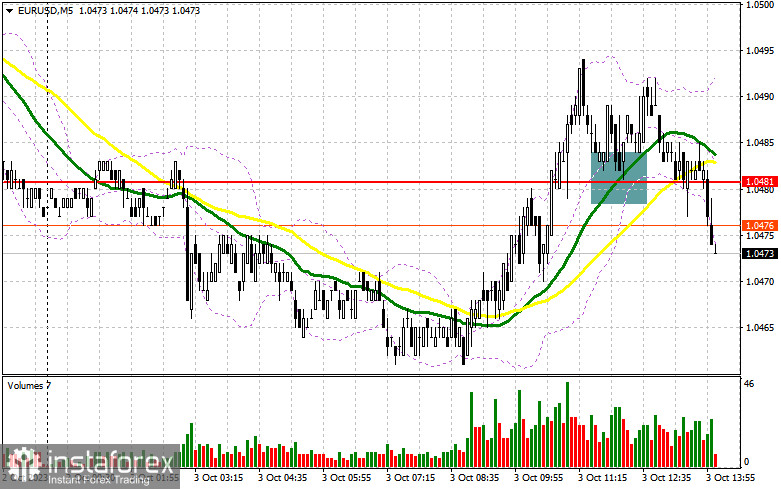
In my morning forecast, I drew attention to the level of 1.0481 and recommended making trading decisions based on it. Let's take a look at the 5-minute chart and analyze what happened there. The breakthrough and subsequent test of 1.0481 led to a buy signal for the euro in anticipation of an upward correction, but after a 10-point upward movement, pressure returned to the pair. In the second half of the day, the technical picture was reevaluated.
To open long positions on EUR/USD, the following is required:
As you can see on the chart, in the absence of statistics and overall pessimism due to expectations of further interest rate hikes, pressure on the Euro returned as soon as any upward correction occurred. Be extremely cautious when opening long positions because it appears that sellers will dominate the second half of the day. The speech of FOMC member Raphael Bostic may remind traders that the interest rate hikes in the US are not over yet, which will strengthen the dollar. The report on job vacancies and labor turnover from the Bureau of Labor Statistics is unlikely to be of significant interest. I will only act in the vicinity of the new support at 1.0446, which we did not reach in the first half of the day. The formation of a false breakout there will provide a good entry point for long positions against the bearish market, with the target of updating the resistance at 1.0492, just above which the moving averages, favoring sellers, are located. Breaking and testing this range from top to bottom will strengthen demand for the euro, giving it a chance to jump to 1.0524. The ultimate target will be the area around 1.0560, where I will make profits. In the case of a further decline in EUR/USD and a bearish reaction to the released data, don't forget that the downtrend is still intact, and with no activity at 1.0446, it's better to postpone purchases until a false breakout forms around 1.0395—another annual low. I will consider opening long positions from 1.0346 with the aim of an upward correction of 30-35 points within the day.
To open short positions on EUR/USD, the following is required:
The first half of the day's activities served as evidence that sellers continue to dominate the market. Protecting the closest resistance level at 1.0492, which will form by the end of the European session, or a false breakout at this level, will be a good place to start selling with a move down to the new low at 1.0446 if the pair rises as a result of what Fed officials say. Only after breaking and consolidating below this range, as well as a bottom-up retest, do I expect to get another sell signal with the aim of reaching 1.0395. The ultimate target will be the area around 1.0346, which will reinforce the bearish trend. In the event of an upward movement in EUR/USD during the American session and the absence of bears at 1.0492, buyers will have a chance for a recovery in the pair. In such a scenario, I will postpone short positions until the new resistance at 1.0524. Selling can be considered, but only after an unsuccessful consolidation. I will consider opening short positions from the peak at 1.0560 with the aim of a downward correction of 30-35 points.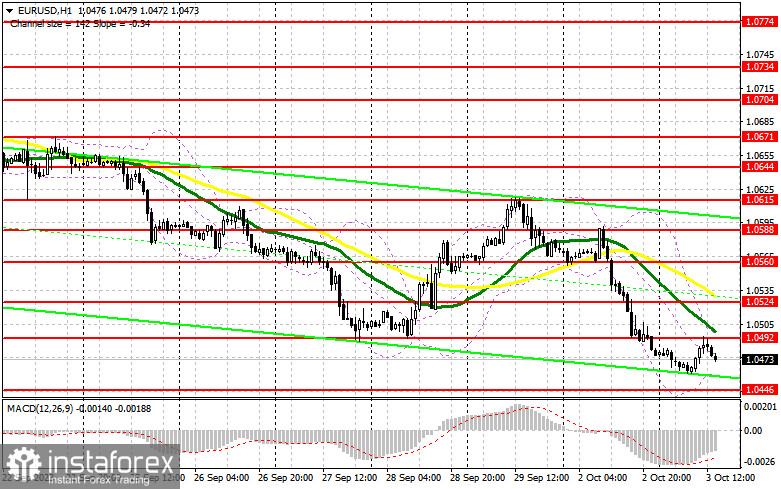
Indicator signals:
Moving Averages
Trading is conducted below the 30 and 50-day moving averages, indicating a decline in the pair.
Note: The author considers the period and prices of the moving averages on the H1 hourly chart, which differs from the standard definition of classical daily moving averages on the D1 daily chart.
Bollinger Bands
In the case of a decline, the lower boundary of the indicator around 1.0450 will act as support.
Description of indicators:
• Moving average (determines the current trend by smoothing volatility and noise). Period 50. Marked in yellow on the chart.
• Moving average (determines the current trend by smoothing volatility and noise). Period 30. Marked in green on the chart.
• MACD indicator (Moving Average Convergence/Divergence) - Fast EMA period 12. Slow EMA period 26. SMA period 9.
• Bollinger Bands - Period 20.
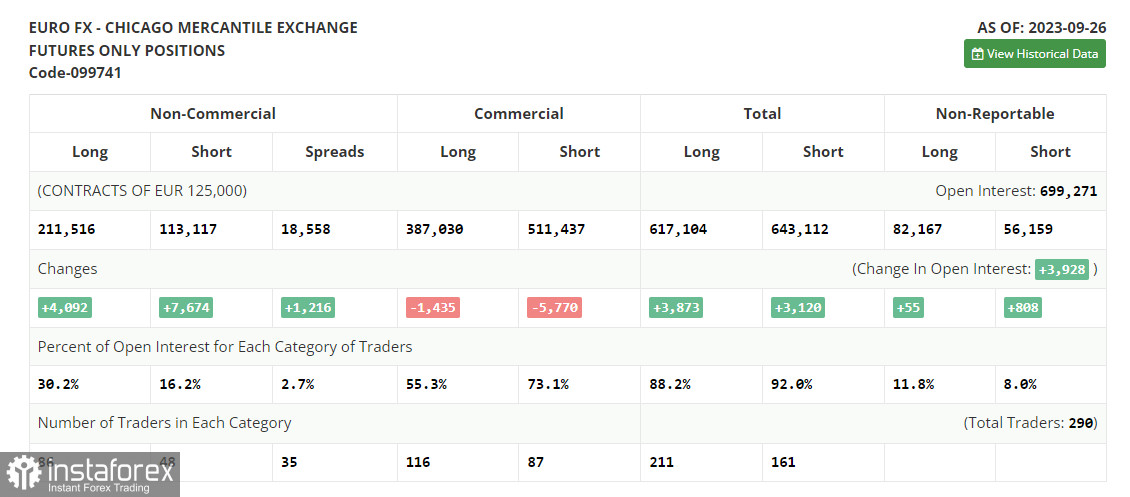
• Non-commercial traders - speculators, such as individual traders, hedge funds, and large institutions using the futures market for speculative purposes and meeting specific requirements.
• Long non-commercial positions represent the total long open positions of non-commercial traders.
• Short non-commercial positions represent the total short open positions of non-commercial traders.
• The total non-commercial net position is the difference between the short and long positions of non-commercial traders.


