


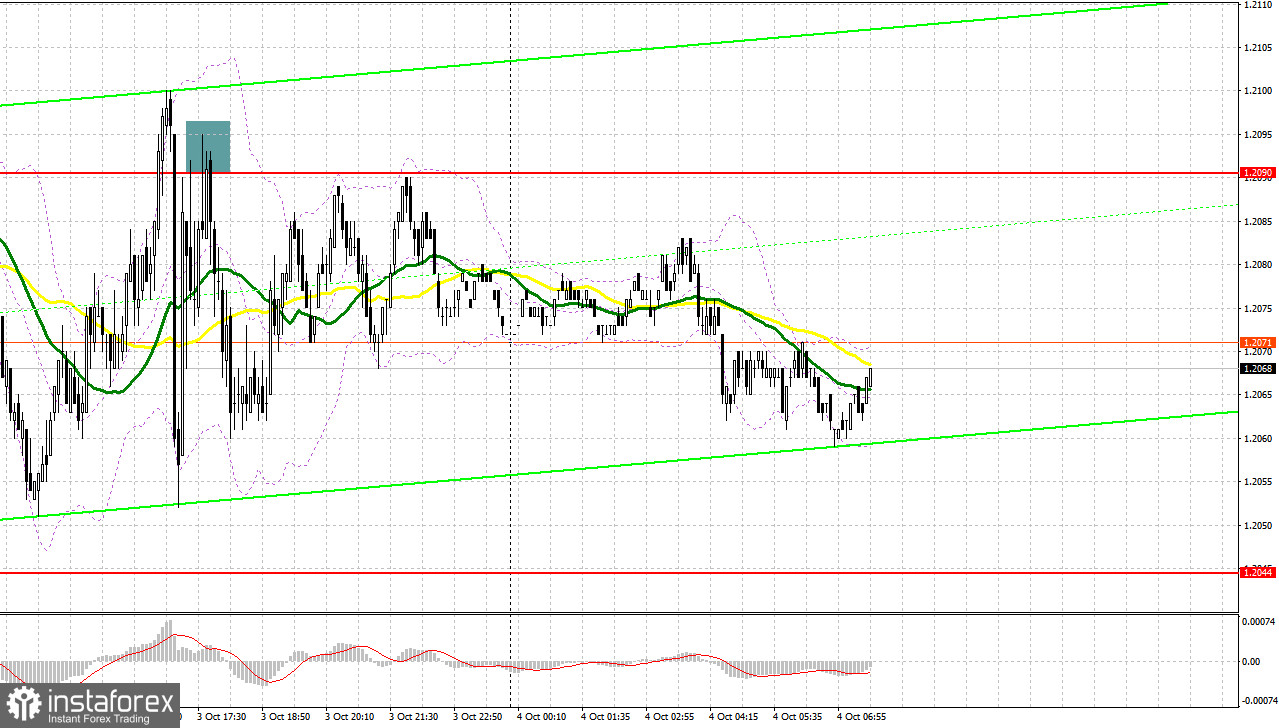
Yesterday, the pair formed several entry signals. Let's see what happened on the 5-minute chart. In my morning review, I mentioned the level of 1.2079 as a possible entry point. A rise and a false breakout at this mark formed a sell signal. As a result, GBP/USD fell by 30 pips. In the afternoon, traders actively defended the new resistance at 1.2090 which produced a sell signal that sent the quotes down by another 30 pips.
For long positions on GBP/USD:
Today, the bulls will count on the UK Services PMI data. This indicator is very important for future GDP growth rates. An even bigger contraction compared to the preliminary estimate for September will lead to another GBP/USD sell-off, which I intend to capitalize on. I plan to act around the new low of 1.2055. A false breakout at this level could provide an initial long entry against the bearish trend with a corrective target at the nearest resistance of 1.2097, which is in line with the bearish moving averages. A breakout and stabilization above this range on the back of good Services PMI data might pave the way for a bullish correction, bolstering buyers' confidence. This would signal the opening of long positions targeting 1.2153. The ultimate target would be the 1.2216 area where I'd be looking to take profits. If the pair declines to 1.2055 without buyer activity, bearish pressure on the pound will likely return, opening the path to a low of 1.2012. A false breakout here would signal long entries. I plan to instantly buy GBP/USD on a bounce from the 1.1972 low, aiming for a daily intraday correction of 30-35 pips.
For short positions on GBP/USD:
Bears should guard the nearest resistance at 1.2097. An ideal scenario would be a false breakout at this level, along with a weak PMI data, generating a sell signal with a movement towards the new yearly low at 1.2055. Breaching this level and subsequently retesting it from below would challenge the bullish sentiment, providing a window to target support at 1.2012. The more distant target will be 1.1972, where I'd be taking profits. If GBP/USD grows and there are no bears at 1.2097, the demand for the pound may weaken. In this case, I'd postpone short positions until a false breakout at 1.2153 occurs. If there is no downward movement there, I'd sell the pound on an immediate rebound from 1.2216, aiming for a downward correction of 30-35 pips.
COT report:
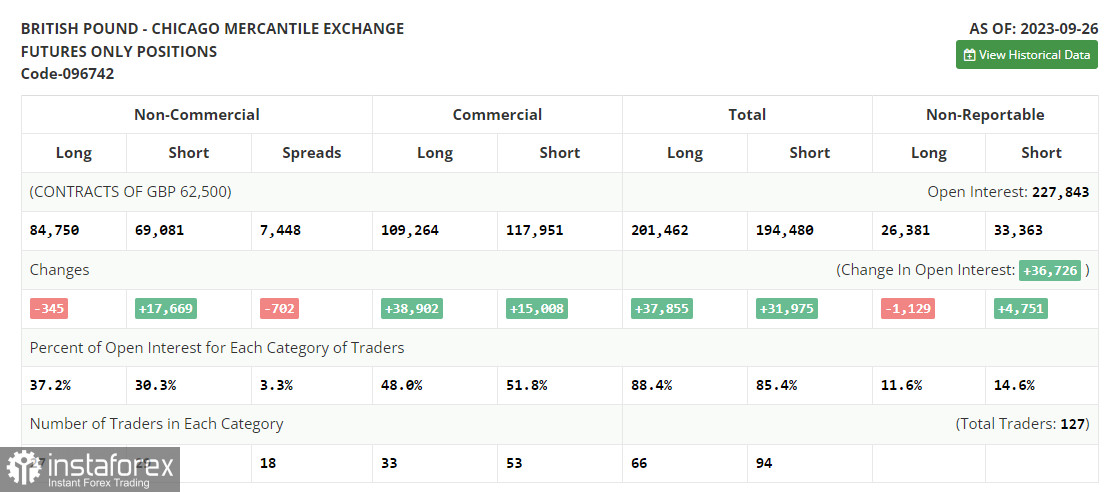
The COT (Commitment of Traders) report for September 26 logged a decrease in long positions and a very large increase in short positions. It means there are fewer and fewer buyers of the pound sterling, especially after downbeat UK GDP data. The UK economic growth is expected to slow down significantly in the 3rd quarter. No wonder, the British pound is actively falling against the US dollar. The latest COT report said long non-commercial positions fell by 345 to 84,750, while short non-commercial positions increased by 17,669 to 69,081.
Indicator signals:
Moving Averages
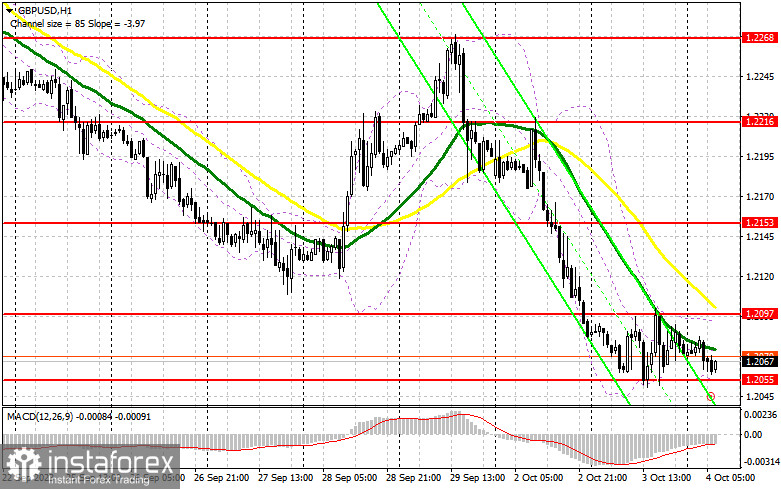
The instrument is trading below the 30 and 50-day moving averages. It indicates that GBP/USD is likely to decline lower.
Please note that the time period and levels of the moving averages are analyzed only for the H1 chart, which differs from the general definition of the classic daily moving averages on the D1 chart.
Bollinger Bands
If the pair declines, the lower band of the indicator around 1.2055 will act as support.
Description of indicators:
• A moving average of a 50-day period determines the current trend by smoothing volatility and noise; marked in yellow on the chart;
• A moving average of a 30-day period determines the current trend by smoothing volatility and noise; marked in green on the chart;
• MACD Indicator (Moving Average Convergence/Divergence) Fast EMA with a 12-day period; Slow EMA with a 26-day period. SMA with a 9-day period;
• Bollinger Bands: 20-day period;
• Non-commercial traders are speculators such as individual traders, hedge funds, and large institutions who use the futures market for speculative purposes and meet certain requirements;
• Long non-commercial positions represent the total number of long positions opened by non-commercial traders;
• Short non-commercial positions represent the total number of short positions opened by non-commercial traders;
• The non-commercial net position is the difference between short and long positions of non-commercial traders.


