


Trend analysis (Fig. 1).
The EUR/USD currency pair may move upward from the level of 1.0465 (closing of yesterday's daily candle) to 1.0519, the historical support level (blue dotted line). Upon reaching this level, a continued upward movement is possible with the target of 1.0566, the 13-period EMA (yellow thin line).
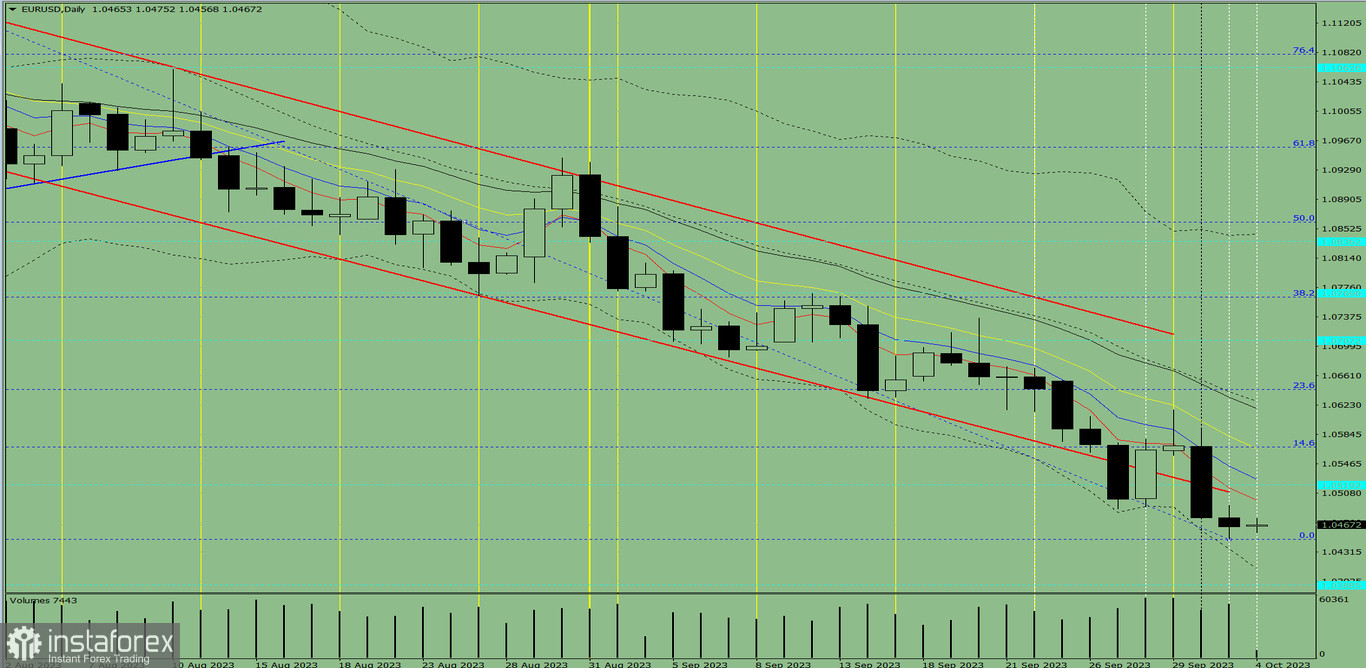
Fig. 1 (daily chart).
Comprehensive analysis:
- Indicator analysis – up;
- Fibonacci levels – up;
- Volumes – up;
- Candlestick analysis – up;
- Trend analysis – up;
- Bollinger bands – up;
- Weekly chart – up.
General conclusion: Today, the price may move upward from the level of 1.0465 (closing of yesterday's daily candle) to 1.0519, the historical support level (blue dotted line). Upon reaching this level, a continued upward movement is possible with the target of 1.0566, the 13-period EMA (yellow thin line).
Alternatively, the price may move downward from the level of 1.0465 (closing of yesterday's daily candle) to 1.0410, the lower limit of the Bollinger Band indicator (black dotted line). Upon reaching this level, an upward movement is possible with a target of 1.0499, the 5-period EMA (red thin line).


