


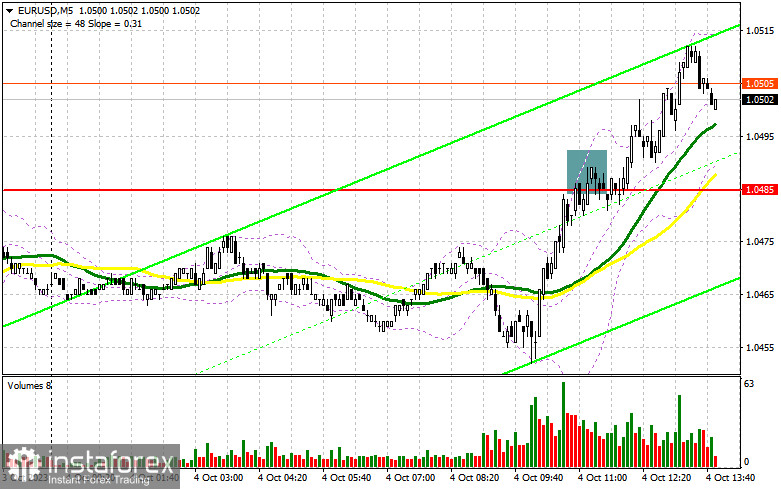
In my morning forecast, I emphasized the level of 1.0485 and recommended using it as a reference point for market entry decisions. Let's examine the 5-minute chart and analyze what happened there. The rise and formation of a false breakout at this level generated a sell signal for the euro, but there was no downward movement, leading to loss realization. The technical picture was reevaluated for the second half of the day.
To open long positions on EUR/USD, the following conditions are required:
Surprisingly strong statistics on activity in the service sectors of Eurozone countries provided support for the euro in the first half of the day. This allowed for a rebound from the annual minimum and a small upward correction. However, the further direction will depend entirely on similar data for the US Non-Manufacturing Purchasing Managers' Index (ISM). Good figures, along with an increase in the ADP employment change, will lead to a return of the US dollar to its positions and a decline in the currency pair. Speeches by FOMC members Michelle Bowman and Lael Brainard should not be ignored either. But considering the current sentiment of buyers, I will only act in the area of the new support at 1.0485, which served as resistance earlier in the morning. A false breakout formation there will provide a good entry point for long positions against the bearish market, aiming for further upward correction of the pair with a target of updating resistance at 1.0524. Breaking and testing this range from top to bottom will strengthen demand for the euro, allowing for a surge toward 1.0560. The ultimate target will be the 1.0588 area, where I will take profits. In the event of a decline in EUR/USD and a bearish reaction to the US data, as well as hawkish comments from Fed representatives and the absence of activity at 1.0485, it is better to postpone buying until a false breakout is formed around 1.0445. I will open long positions from 1.0408 with a target of an upward correction of 30-35 points within the day.
To open short positions on EUR/USD, the following conditions are required:
Sellers have slightly weakened their control of the market, but it's too early to talk about any significant changes. Let's see how the day closes, and we will see from there. If the pair keeps going up after Fed officials say something, protecting the nearest resistance at 1.0524 or a false breakout at that level will be a good place to start selling with a move down to the new support at 1.0485, where the moving averages are, which will help the bulls. Only after breaking and consolidating below this range, as well as a bottom-up retest, do I expect to receive another sell signal with a target to reach 1.0445. The ultimate target will be the 1.0408 area, reinforcing the bearish trend. In the event of EUR/USD moving upward during the American session and the absence of bears at 1.0524, buyers will have a chance to recover the pair. In such a scenario, I will postpone short positions until a new resistance at 1.0560 is formed. Selling can be considered, but only after an unsuccessful consolidation. I will open short positions immediately on the rebound from 1.0588, with a target of a 30-35 point downward correction.
Indicator Signals:
Moving Averages
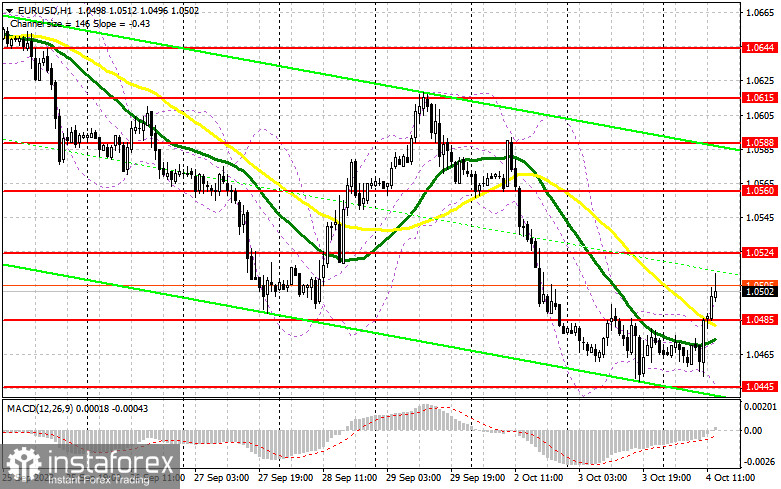
Trading is conducted above the 30 and 50-day moving averages, indicating an attempt by the bulls to establish an upward correction of the pair.
Note: The period and prices of moving averages considered by the author are on the hourly H1 chart and differ from the general definition of classical daily moving averages on the daily D1 chart.
Bollinger Bands
In case of a decline, the lower boundary of the indicator at around 1.0445 will act as support.
Description of indicators:
• Moving Average (determines the current trend by smoothing volatility and noise). Period 50. Marked in yellow on the chart.
• Moving Average (determines the current trend by smoothing volatility and noise). Period 30. Marked in green on the chart.
• MACD Indicator (Moving Average Convergence/Divergence) Fast EMA period 12. Slow EMA period 26. SMA period 9.
• Bollinger Bands. Period 20.
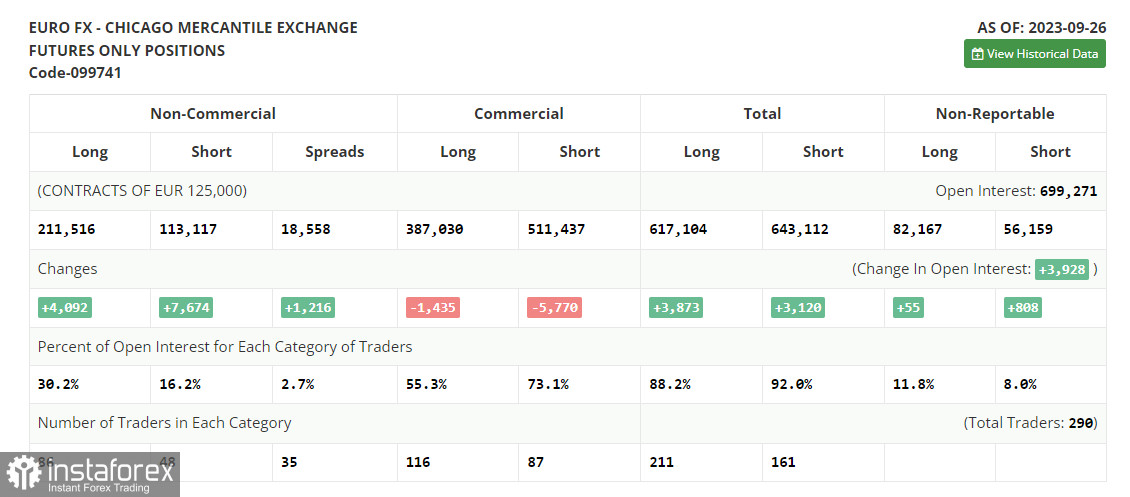
• Non-commercial traders - speculators, such as individual traders, hedge funds, and large institutions using the futures market for speculative purposes and meeting specific requirements.
• Long non-commercial positions represent the total long open positions of non-commercial traders.
• Short non-commercial positions represent the total short open positions of non-commercial traders.
• The net non-commercial position is the difference between the short and long positions of non-commercial traders.


