Analysis of Tuesday's trades:
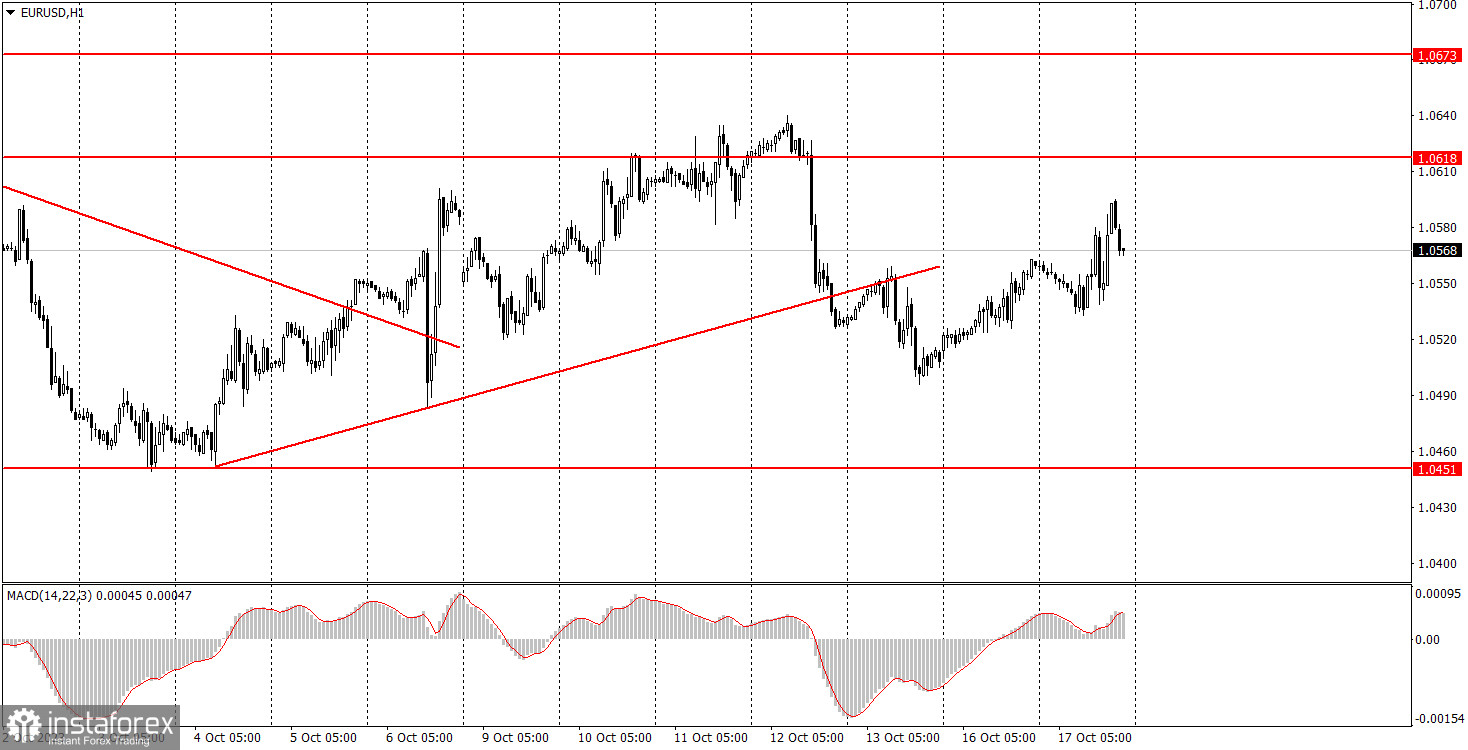
EUR/USD 1H chart

On Tuesday, the EUR/USD currency pair demonstrated a pronounced volatility, underpinned by a flurry of macroeconomic indicators. We had previously cautioned traders about the anticipated release of significant economic data. While these weren't expected to elicit a robust market reaction, they certainly had the potential for moderate market shifts. This environment set the stage for frequent price fluctuations, a trend that became evident as the day unfolded. Throughout the trading session, the pair exhibited indecisiveness, oscillating as the market grappled with interpreting diverse reports. Ultimately, we observed the anticipated uptrend correction, albeit with the pair frequently retracing its steps.
From the European Union, economic expectation indices were presented by the ZEW Institute. Concurrently, the U.S. reported commendable figures in industrial production and retail sales. This data alone underscored the rationale for alternating strength between the euro and the dollar. Further influencing market dynamics, Patrick Harker of the Federal Reserve opined against any further rate hikes, a sentiment that theoretically should exert downward pressure on the dollar. Consequently, this amalgamation of factors rendered the EUR/USD trading landscape notably tumultuous throughout the day.
EUR/USD 5M chart

On the 5-minute timeframe on Tuesday, there was an abundance of trading signals. We reintroduced the 1.0533 level to the chart, yet this did not simplify matters. All four signals materialized around the 1.0559 mark, making them somewhat redundant for analysis. Each of these indicators turned out to be false positives, with the most significant movement in the right direction post-signal being a mere 23 points. Given these dynamics and an overall volatility of 60 points, banking on substantial profits proved challenging. Furthermore, with the pair reversing every one and a half to two hours, even the most optimistic trader would find it hard to count on solid signals.
Trading ideas for Wednesday:
On the hourly timeframe, the pair has shown a sharp decline, potentially marking the onset of a full-fledged downtrend. We've consistently articulated our anticipation of a decline in the euro over the medium term. However, we were also factoring in a more pronounced pair correction. Our expectation was that this week would see the start of a new trend phase, and current trajectories seem to confirm this. On 5-minute timeframe tomorrow, the key levels are the following: 1.0391, 1.0433, 1.0451, 1.0483, 1.0533, 1.0559, 1.0611-1.0618, 1.0673, 1.0733, 1.0767-1.0781, and 1.0835. Once a movement of 15 points in the desired direction is observed, a break-even Stop Loss can be positioned. On Wednesday, we'll hear from Christine Lagarde, though significant market-moving revelations from her speech are not anticipated. Additionally, the final inflation figures for September will be released, which again, should not be expected to have a major impact. From the U.S., a moderately important report on building permits will be made public.
Basic rules of a trading system:
1) Signal strength is determined by the time taken for its formation (either a bounce or level breach). A shorter formation time indicates a stronger signal.
2) If two or more trades around a certain level are initiated based on false signals, subsequent signals from that level should be disregarded.
3) In a flat market, any currency pair can produce multiple false signals or none at all. In any case, the flat trend is not the best condition for trading.
4) Trading activities are confined between the onset of the European session and mid-way through the U.S. session, post which all open trades should be manually closed.
5) On the 30-minute timeframe, trades based on MACD signals are only advisable amidst substantial volatility and an established trend, confirmed either by a trend line or trend channel.
6) If two levels lie closely together (ranging from 5 to 15 pips apart), they should be considered as a support or resistance zone.
How to read charts:
Support and Resistance price levels can serve as targets when buying or selling. You can place Take Profit levels near them.
Red lines represent channels or trend lines, depicting the current market trend and indicating the preferable trading direction.
The MACD(14,22,3) indicator, encompassing both the histogram and signal line, acts as an auxiliary tool and can also be used as a signal source.
Significant speeches and reports (always noted in the news calendar) can profoundly influence the price dynamics. Hence, trading during their release calls for heightened caution. It may be reasonable to exit the market to prevent abrupt price reversals against the prevailing trend.
Beginning traders should always remember that not every trade will yield profit. Establishing a clear strategy coupled with sound money management is the cornerstone of sustained trading success.


