


Having reached a local low at 1.2090 at the end of last week (since October 5th), the GBP/USD pair subsequently corrected by 80 pips, reaching an important short-term resistance level at 1.2170 (200 EMA on the 1-hour chart).
At the beginning of today's European trading session, the price attempted to break above this resistance level, rising to an intraday high of 1.2184. However, this attempt proved unsuccessful, and GBP/USD later returned to a decline.
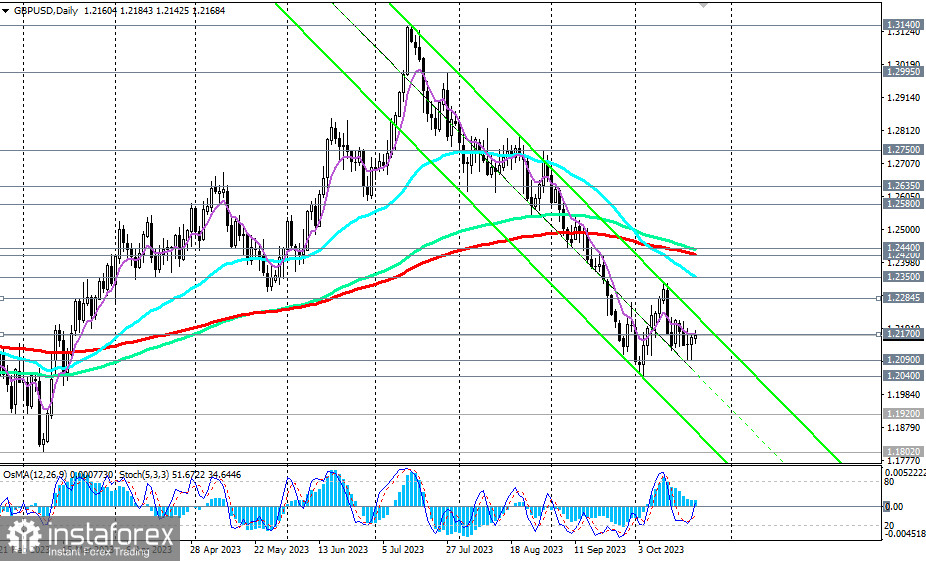
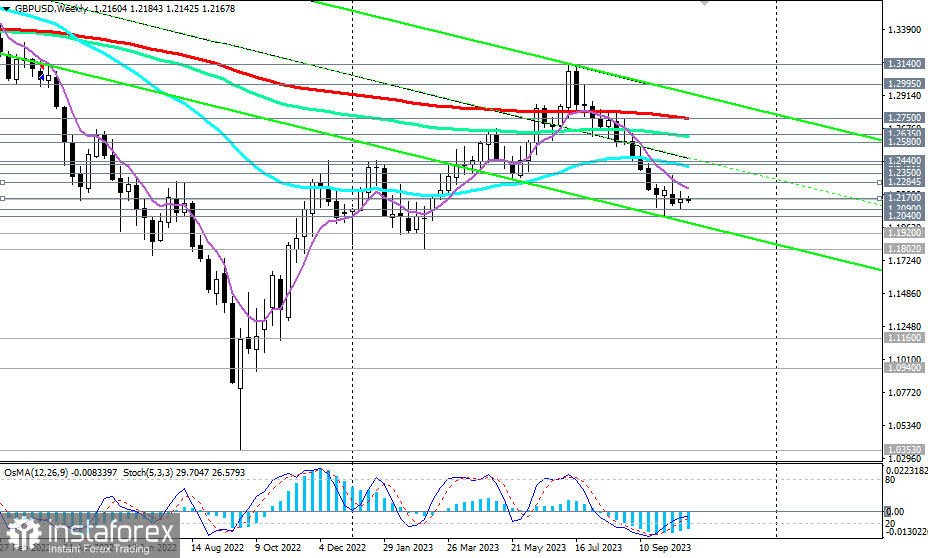
In general, GBP/USD remains within the zone of medium and long-term bearish markets, below the key levels of 1.2420 (200 EMA on the daily chart) and 1.2750 (200 EMA on the weekly chart).
Therefore, any new signs of U.S. dollar strength or pound weakness will lead to a resumption of the GBP/USD downward trend. The earliest signal for new short positions could be a breakdown of the short-term support level at 1.2150 (200 EMA on the 15-minute chart), with a confirmation being a break below the local support level at 1.2090. The nearest target for the decline is near the local low at 1.2040.
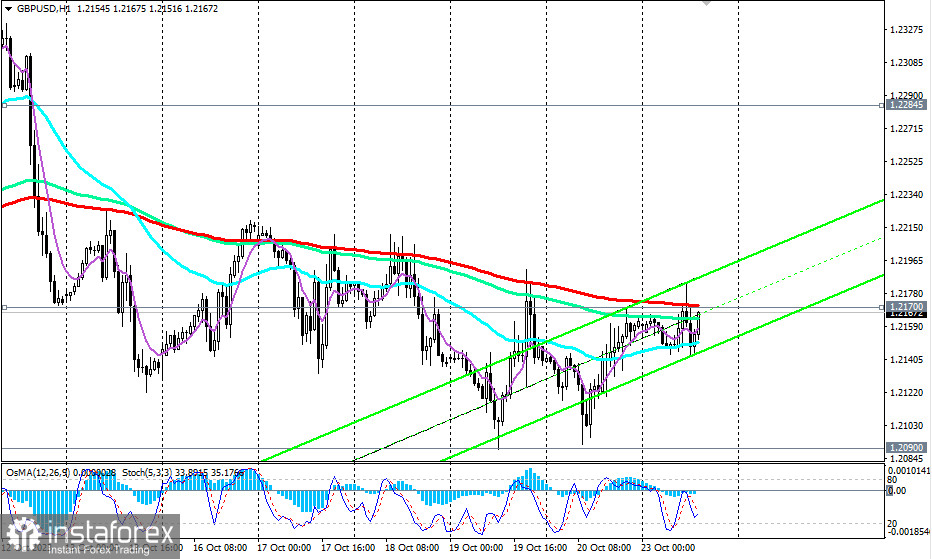
In an alternative scenario, after confirming the breakout of resistance levels at 1.2170, 1.2220 (high), and 1.2285 (200 EMA on the 4-hour chart), the upward movement will continue towards the key resistance levels of 1.2420 and 1.2440 (144 EMA on the daily chart). In the case of their breakout, GBP/USD will return to the medium-term bullish market zone, and after breaking the key resistance level of 1.2750 (200 EMA on the weekly chart), it will enter the long-term bullish market zone.
Support levels: 1.2150, 1.2100, 1.2090, 1.2040, 1.2000, 1.1920, 1.1900, 1.1800
Resistance levels: 1.2170, 1.2200, 1.2220, 1.2285, 1.2300, 1.2350, 1.2400, 1.2420, 1.2440, 1.2500, 1.2580, 1.2600, 1.2635, 1.2700, 1.2750, 1.2800, 1.2900, 1.2995, 1.3100, 1.3140, 1.3200


