


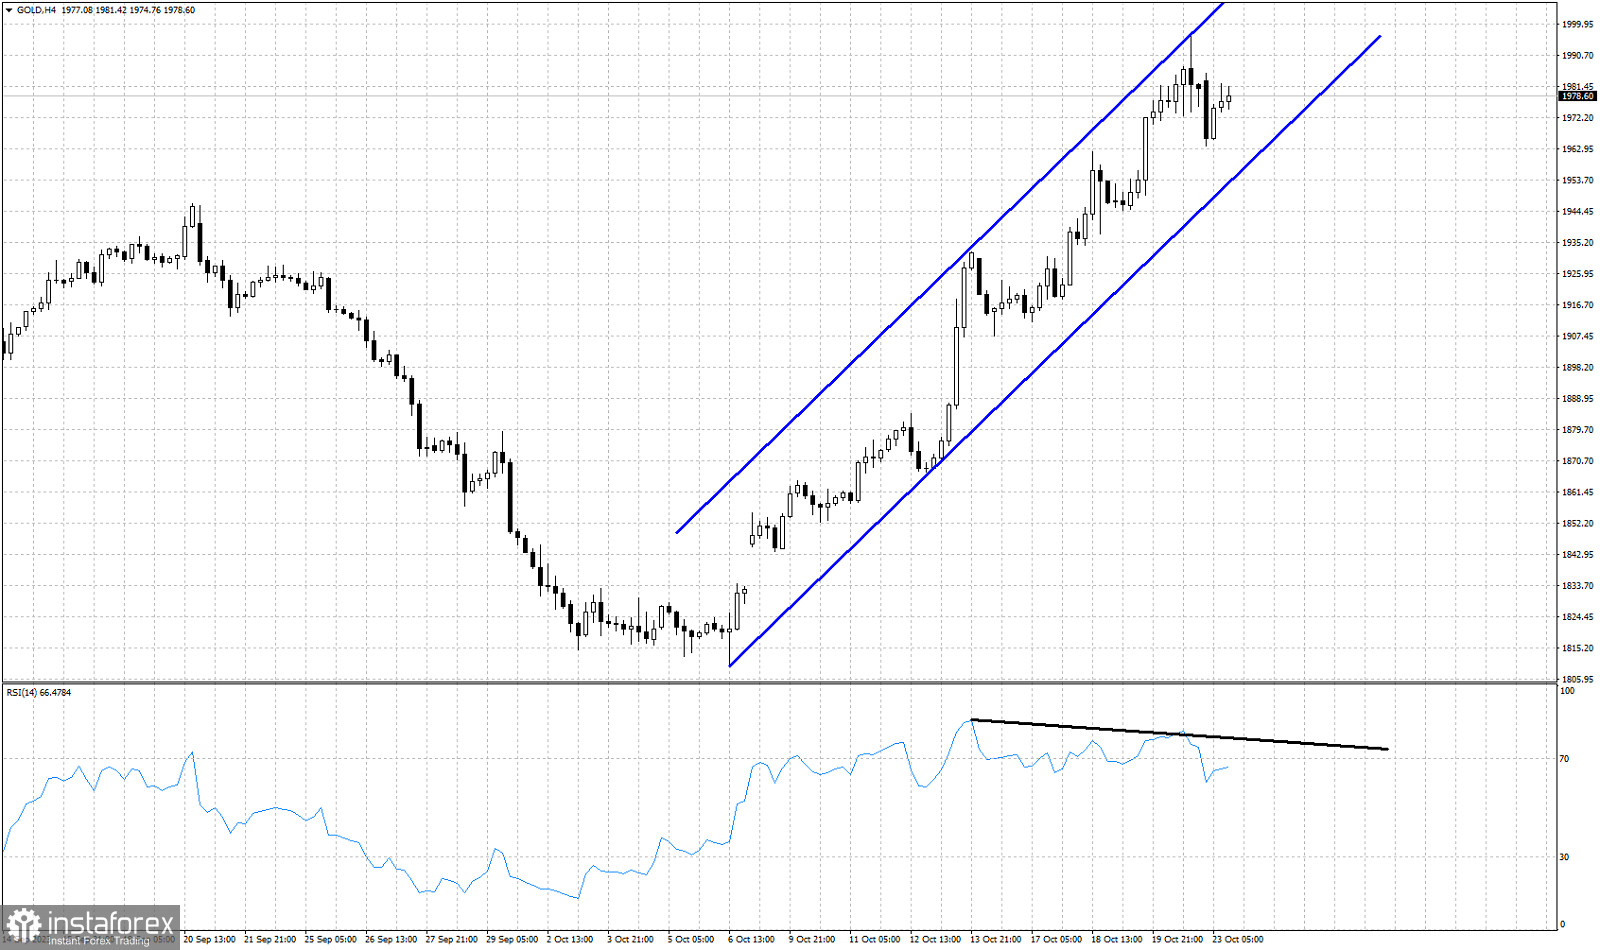
Blue lines - Bullish channel
Black line- bearish RSI divergence
Gold price is trading around $1,976 today, slightly lower from Friday's close. Price remains in a short-term bullish trend as price continues making higher highs and higher lows inside the blue upward sloping channel. In the 4 hour chart we observe the RSI has provided a bearish divergence. As we mentioned in a previous post Gold price has reached overbought levels in the near term and a pull back is justified. Short-term support by the bullish channel is found at $1,955. A break below this level will open the way for a deeper pull back towards $1,930-$1,900. For now bulls remain in control of the short-term trend and a new higher high is not out of the question. So far no reversal signal. Only a warning by the RSI.


