


Trend analysis (Fig. 1).
The GBP/USD currency pair may move downward from the level of 1.2295 (closing of yesterday's daily candle) to 1.2248, the 50% pullback level (yellow dotted line). In the case of testing this level, an upward movement is possible with the target at 1.2306, the 38.2% pullback level (red dotted line), where the ascent may continue.
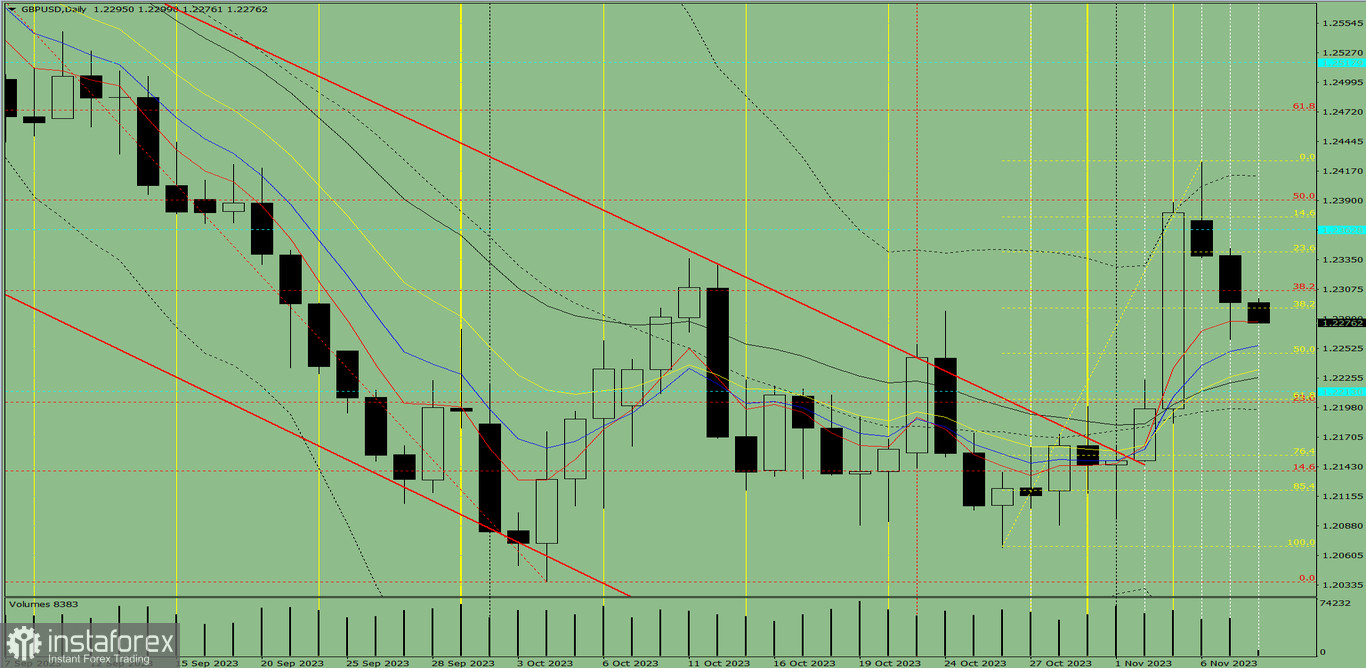
Fig. 1 (daily chart).
Comprehensive analysis:
- Indicator analysis – down;
- Fibonacci levels – down;
- Volumes – down;
- Candlestick analysis – down;
- Trend analysis – down;
- Weekly chart – down;
- Bollinger bands – up.
General conclusion: Today, the price may move downward from the level of 1.2295 (closing of yesterday's daily candle) to 1.2248, the 50% pullback level (yellow dotted line). In the case of testing this level, an upward movement is possible with the target at 1.2306, the 38.2% pullback level (red dotted line), where the ascent may continue.
Alternatively, the price may move downward from the level of 1.2295 (closing of yesterday's daily candle) to 1.2226, the 21-day EMA (black thin line). In the case of testing this level, an upward movement is possible with the target at 1.2306, the 38.2% pullback level (red dotted line). A test of this level may let the price continue the ascent.


