EUR/USD
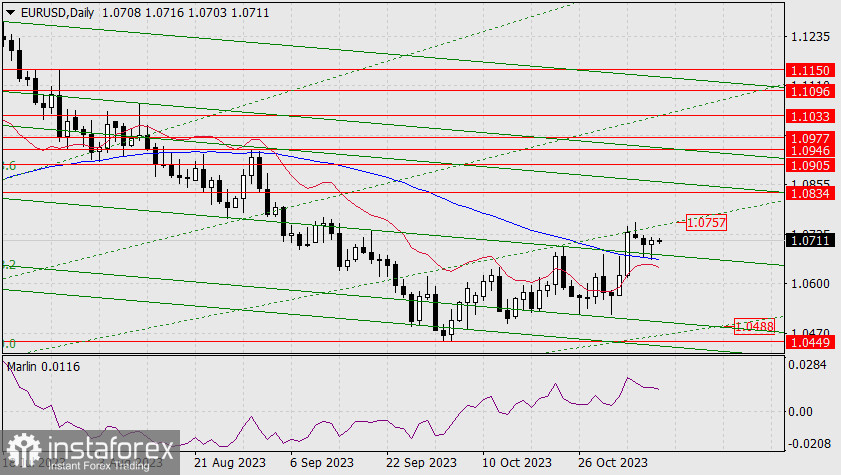
Yesterday, the euro tried to overcome the support of the MACD indicator line on the daily chart. Just like its first attempt on Tuesday, it failed once again. The probability of an upward move while breaching the Fibonacci ray (1.0757) became even higher. Only the Marlin oscillator is lagging behind in its upward reversal, allowing the price to continue consolidation.

A breakout above 1.0757 (matching the November 6th high) opens up the target at 1.0834 (July low). Slightly above the target level is the green channel's price line. If the price firmly settles below yesterday's low, it could move towards the point of intersection of the lower channel line with the Fibonacci ray, at the level of 1.0488.

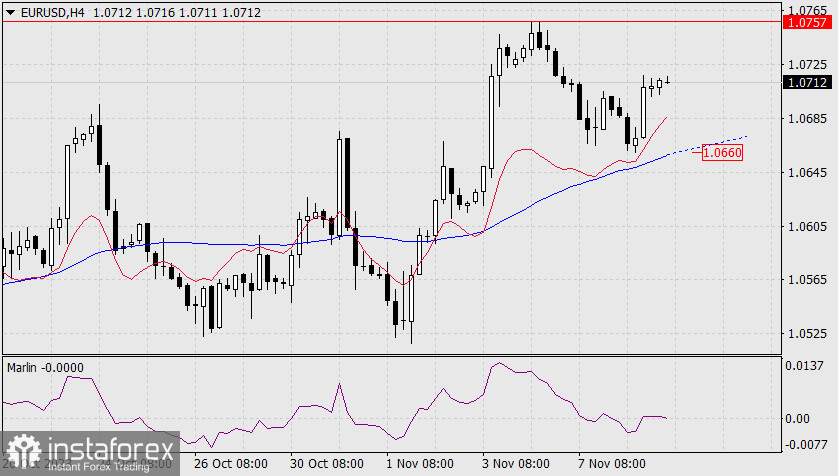
On the 4-hour chart, the technical picture indicates the end of the bearish correction, which will bring back the uptrend. The reversal occurred as the price approached the indicator lines. The Marlin oscillator's signal line is crossing the neutral boundary into the uptrend territory. The support of the MACD line coincides with yesterday's low at 1.0660, so the price, sensing a strong level, is unlikely to attack it in the context of the uptrend. Alternatively, if events unfold differently, it may settle below it and accelerate its downward move


