


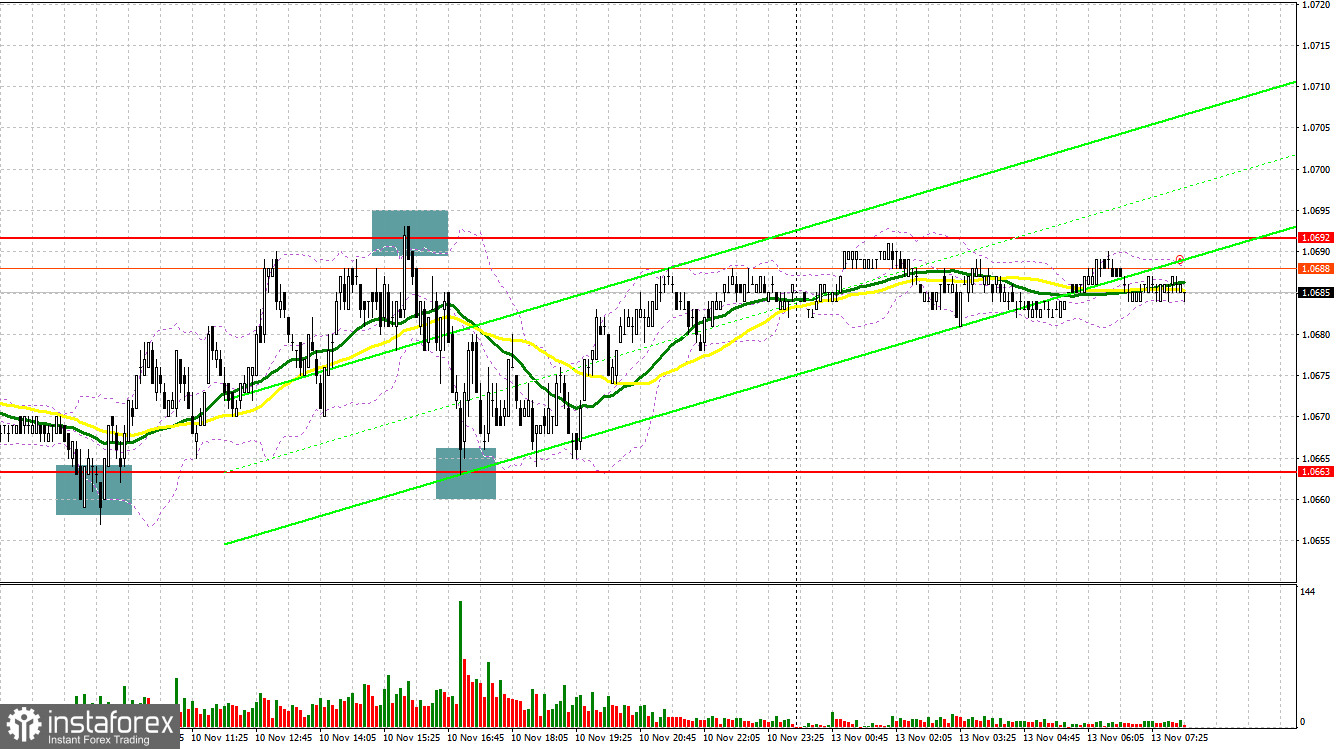
Last Friday, several excellent market entry signals were formed. Let's examine the 5-minute chart to understand what happened. In my previous forecast, I underscored the significance of the 1.0663 level and recommended using it as a basis for market entry decisions. The decline and a false breakout around 1.0663 generated a great buying signal for the Euro. As a result, EUR/USD rose by more than 30 pips. In the second half of the day, defending the 1.0692 level and the false breakout there provided a sell signal, with a significant drop back to 1.0663. With another defense of this area, traders added more buy positions, driving the pair upwards by 20 pips.
What is needed to open long position on EUR/USD
The comments of the Federal Reserve policymakers didn't significantly influence the market direction. Data on high inflation expectations offset the weak consumer sentiment index in the US on Friday. Today, the economic calendar is almost empty, except for the forecast publication from the European Commission, so EUR/USD might remain trading within Friday's sideways channel. The sellers are likely to continue pushing for a breakout of 1.0663. If there's a negative market reaction to the forecast and statements from the European Central Bank representatives, the buyers will have to assert their strength again around the crucial support level of 1.0663. Only a false breakout there, similar to what I discussed earlier, will provide a good entry point for long positions in anticipation of a further uptrend during which I expect testing the resistance at 1.0692, formed over the last week. That's also where the moving averages, favoring the sellers, are located. A breakout of this range from the top-down will offer a chance for a surge to 1.0722. The highest target will be the 1.0753 area, where I plan to lock in profits. If EUR/USD declines and there's no activity at 1.0663 in the first half of the day, pressure on the euro will increase quite rapidly, intensifying the downward correction and leading to a larger downward move towards 1.0642. Only a false breakout there will create a market entry signal. I'll be opening long positions immediately on the dip from 1.0616, aiming for an upward correction of 30-35 pips within the day.
What is needed to open short positions on EUR/USD
On Friday, the sellers made an attempt again but to no avail. To develop a new bearish market, it is necessary to defend the nearest resistance at 1.0692 and break below 1.0663. In case EUR/USD rises following statements from the ECB representatives, a false breakout at 1.0692 will provide a good sell signal to continue the downward correction towards the 1.0663 support, which has been tested five times recently. If the instrument breaks through and settles below this range and makes a reverse test from bottom to top, I anticipate another sell signal, targeting 1.0642. The ultimate goal will be the low of 1.0616, where I plan to lock in profits. If EUR/USD moves upwards during the European session and there are no bears at 1.0692, the buyers will return to the market, aiming to reach the upper border of the sideways channel at 1.0722. There, it's possible to sell, but again only after an unsuccessful consolidation. I'll be opening short positions immediately on the rebound from the weekly high of 1.0753, aiming for an intraday downward correction of 30-35 pips.
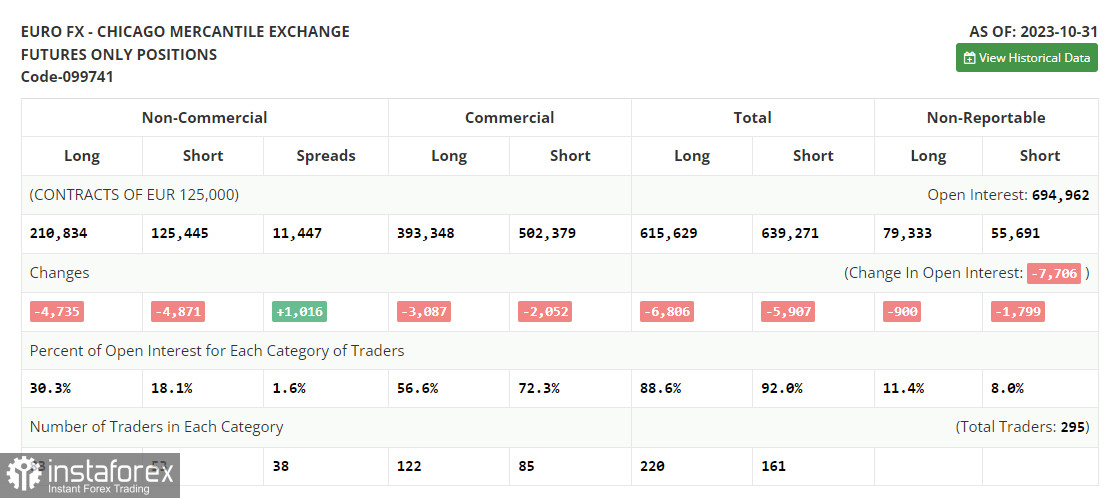
In the Commitment of Traders (COT) report dated October 31, market participants cut both long and short positions. Such positioning was ahead of the policy meeting of the US Federal Reserve, where decisions were made to keep policy settings unchanged. However, weak US nonfarm payrolls, indicating slower growth in hiring, likely led to a more significant realignment of forces, which unfortunately isn't reflected in this COT report. Such statistics recently reinforce the idea among investors that the Federal Reserve will no longer raise interest rates and that aggressive monetary policy could be over as early as the start of next summer. This is exerting and will continue to exert pressure on the US dollar and encourages the rally of risky assets. The COT report stated that non-commercial long positions decreased by 4,735 to 210,834, while non-commercial short positions fell by 4,871 to 125,445. As a result, the spread between long and short positions widened by 1,016. EUR/USD closed last trading week lower at 1.0603 compared to 1.0613 on the previous week.
Indicators' signals
Moving averages
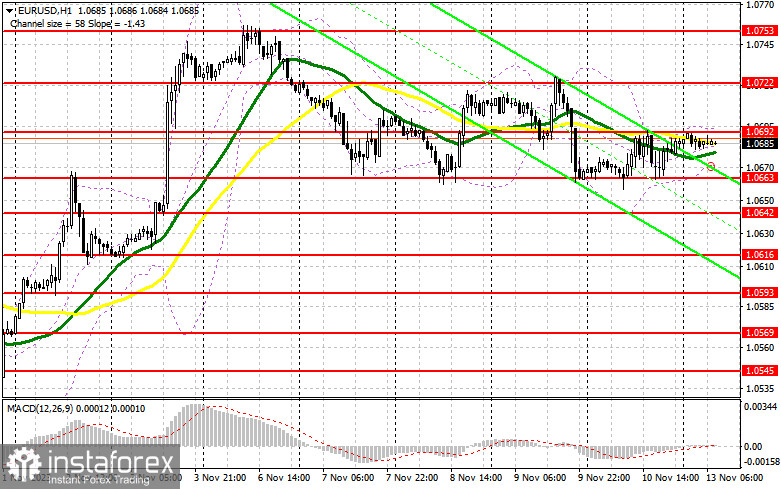
The instrument is trading at around the 30- and 50-day moving averages. It indicates a range-bound market.
Note: The period and prices of the moving averages are considered by the analyst on the 1-hour chart and differ from the general definition of classic daily moving averages on the daily chart.
Bollinger Bands
In case EUR/USD goes down, the indicator's lower border at about 1.0675 will act as support.
Description of indicators
- Moving average (moving average, determines the current trend by smoothing out volatility and noise). Period 50. It is marked yellow on the chart.
- Moving average (moving average, determines the current trend by smoothing out volatility and noise). Period 30. It is marked green on the chart.
- MACD indicator (Moving Average Convergence/Divergence — convergence/divergence of moving averages) Quick EMA period 12. Slow EMA period to 26. SMA period 9
- Bollinger Bands (Bollinger Bands). Period 20
- Non-commercial speculative traders, such as individual traders, hedge funds, and large institutions that use the futures market for speculative purposes and meet certain requirements.
- Long non-commercial positions represent the total long open position of non-commercial traders.
- Short non-commercial positions represent the total short open position of non-commercial traders.
- Total non-commercial net position is the difference between short and long positions of non-commercial traders.


