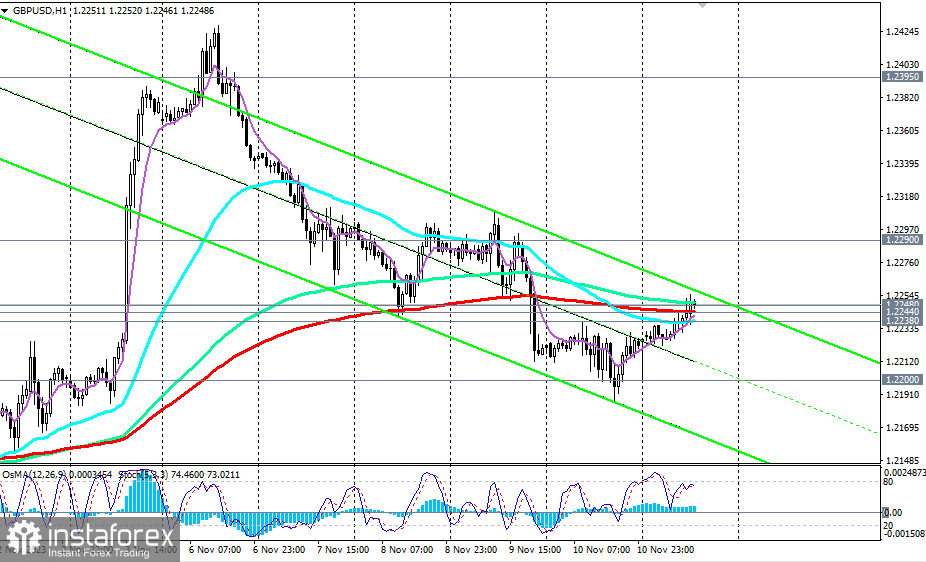
GBP/USD encountered another crucial resistance level at 1.2248 (200 EMA on the 4-hour chart) upon breaking through two important short-term resistance levels at 1.2238 (200 EMA on the 15-minute chart) and 1.2244 (200 EMA on the 1-hour chart) at the beginning of today's European trading session.
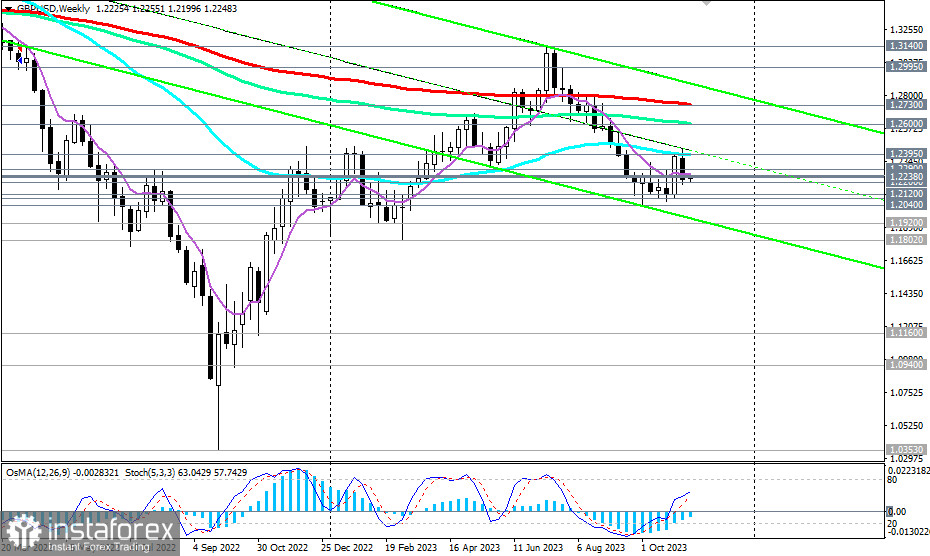
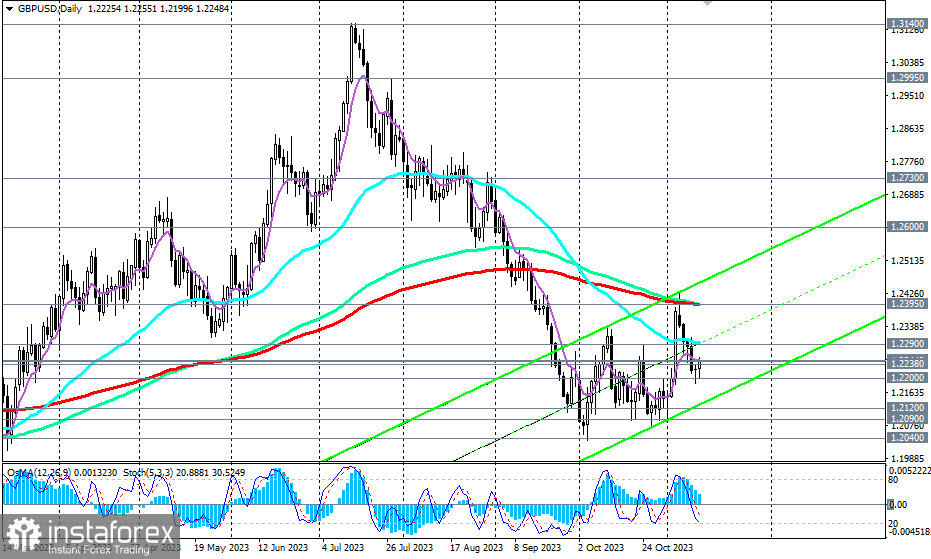
It is possible that this corrective rise of the pair will be limited, considering the overall positive dynamics of the dollar and GBP/USD remaining in the zone of medium-term and long-term bearish markets, below the key levels of 1.2395 (200 EMA on the daily chart) and 1.2730 (200 EMA on the weekly chart), respectively.

If the rise of GBP/USD does not stop at this point, and the price still manages to break above the resistance at 1.2248, the next obstacle in the path of the upward correction of the pair will be the zone of resistance levels at 1.2290 (50 EMA on the daily chart) and 1.2300. And near it, we should again expect a rebound and a resumption of the decline.
In general, we expect a breadown of the support zone at levels 1.2244 and 1.2238, and a resumption of the decline. A breakdown of the local support at the level of 1.2200 will confirm our main forecast and strengthen the negative dynamics of GBP/USD

The nearest target for the decline is near the local lows of 1.2120, 1.2090, 1.2040.
Only in the case of a breakthrough of the resistance levels of 1.2395, 1.2730 will GBP/USD return to the zone of medium-term and long-term bullish markets.
Short positions are a priority below the resistance levels of 1.2300, 1.2400.
Support levels: 1.2244, 1.2238, 1.2200, 1.2120, 1.2100, 1.2090, 1.2040, 1.2000
Resistance levels: 1.2248, 1.2290, 1.2300, 1.2395, 1.2400, 1.2440, 1.2500, 1.2580, 1.2600, 1.2635, 1.2700, 1.2750, 1.2800, 1.2900, 1.2995, 1.3100, 1.3140, 1.3200


