Monday's Trade Analysis:
1H Chart of the EUR/USD Pair.

The EUR/USD currency pair continued to trade sideways on Monday, remaining near its local highs. As mentioned several times recently, the current rise of the European currency is illogical and unjustified. The current rise of the euro is a correction against a stronger downward movement. However, this correction has yet to be concluded. The ascending trendline remains relevant, so novice traders should wait to sell the pair. One should wait for signals to sell or signals indicating a trend reversal before considering opening short positions.
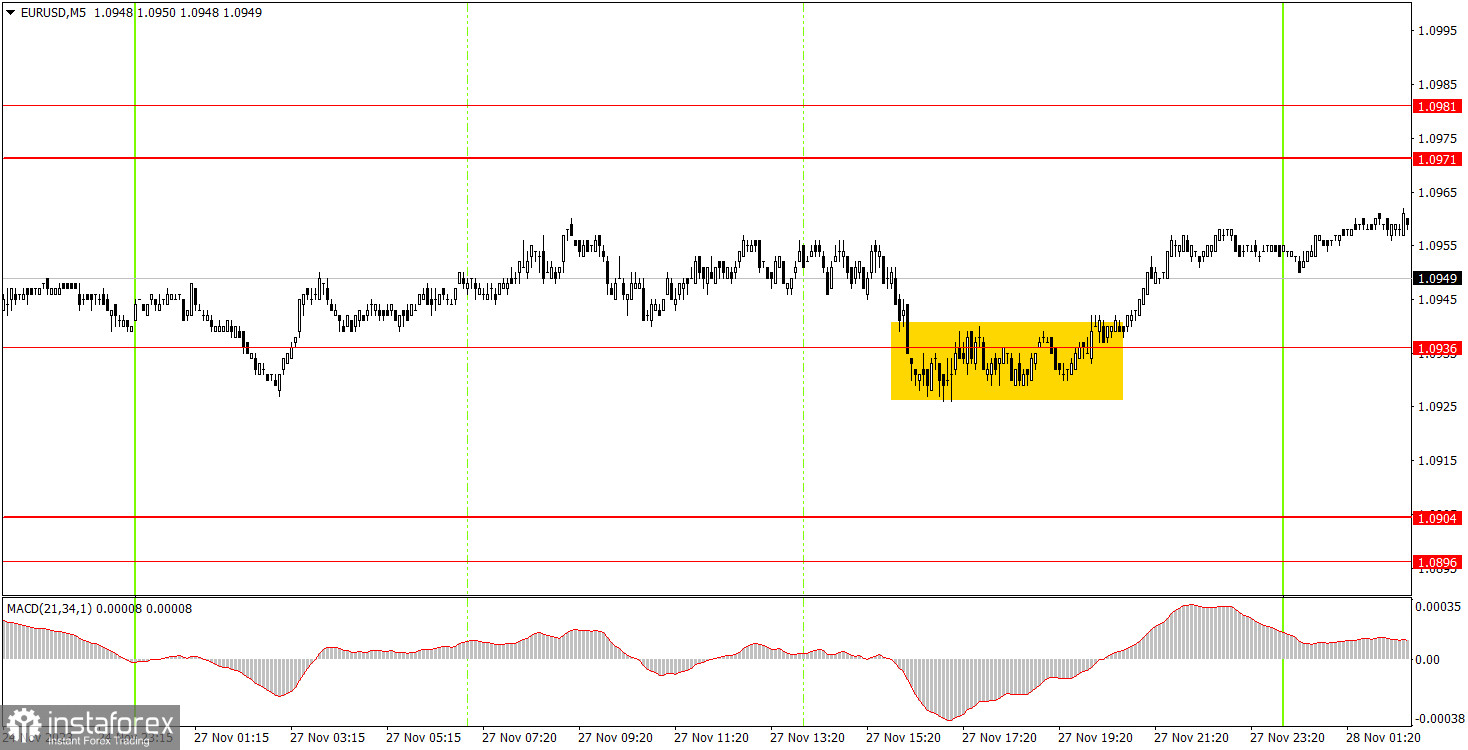
As for Monday's trading, there is little to analyze. The pair showed volatility of only 34 points. As mentioned earlier, 45-50 points are very low, and 34 points practically represent a lack of movement. If there is no movement, trading the pair becomes challenging, especially intraday. Thus, we have an almost stagnant situation – the ascending trend persists, but there is no movement. The situation did not change on Tuesday.
5M Chart of the EUR/USD Pair.

On the 5-minute timeframe, only one trading signal was formed yesterday. During the middle of the American session, the price reached 1.0936, and several hours were spent deciding how to react. In the end, it rebounded from it, albeit very imprecisely, but this rebound could only be recognized in the evening. Entering the market in the evening during intraday trading is not recommended. In any case, there were no interesting movements, events, or macroeconomic publications on Monday.
How to Trade on Tuesday:
On the hourly timeframe, the pair maintains a corrective trend. Correction remains correction, so we expect its completion and the downward trend resumption. There is an ascending trendline, so the price closing below it can determine the completion of the corrective trend. On the 5-minute timeframe, the levels to consider on Tuesday are 1.0568, 1.0611-1.0618, 1.0668, 1.0733, 1.0767-1.0781, 1.0835, 1.0896-1.0904, 1.0936, 1.0971-1.0981, 1.1011, 1.1043, 1.1091. A breakeven stop loss can be set when passing 15 points in the right direction. Tuesday will have many secondary events and practically no important ones. The only important one could be considered Christine Lagarde's speech, but she spoke yesterday as well, and as we can see, she did not report anything significant. This is evident even from the intraday pair movements, which were absent. Therefore, movements may intensify during the American session, but hardly due to fundamental or macroeconomic background.
Main Rules of the Trading System:
- The strength of the signal is determined by the time it takes to form the signal (rebound or level breakthrough). The shorter the time, the stronger the signal.
- If two or more trades were opened around a certain level due to false signals, all subsequent signals from that level should be ignored.
- In a flat, any pair can form many false signals or not form them at all. But in any case, it is better to stop trading at the first signs of a flat.
- Trades are opened between the start of the European session and the middle of the American session when all trades must be closed manually.
- In the 30-minute timeframe, trading based on MACD indicator signals is only possible with good volatility and a confirmed trend supported by a trendline or channel.
- If two levels are located too close to each other (within 5 to 15 points), they should be considered as a support or resistance area.
Charts Overview:
Support and resistance levels are targets when opening buy or sell positions. Take-profit levels can be placed near them.
Red lines are channels or trendlines that reflect the current trend and indicate the preferred direction for trading.
MACD Indicator (14, 22, 3) - histogram and signal line - is an auxiliary indicator that can also be used as a source of signals.
Important speeches and reports (always found in the news calendar) can significantly affect the currency pair's movement. Therefore, during their release, trading should be done with maximum caution or exiting the market to avoid a sharp price reversal against the previous movement.
Beginner forex traders should remember that only some trades can be profitable. Developing a clear strategy and money management are the keys to success in trading over the long term.


