


Analysis of EUR/USD 5M
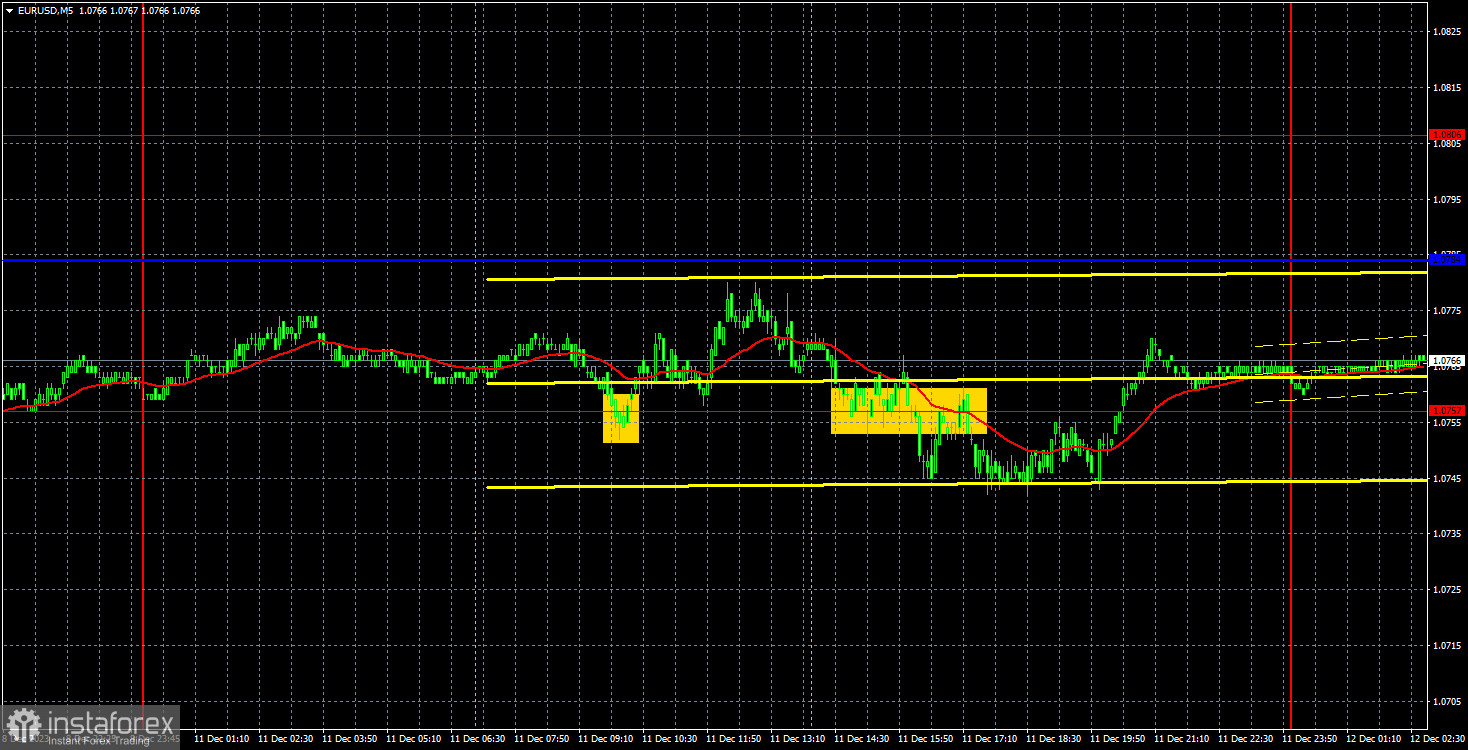
EUR/USD traded with low volatility on Monday, so we did not see any changes in the technical picture. The pair moved from the day's low to the high by less than 40 pips. In general, there was no movement. In this flat market, the price left the descending channel, but we believe that this cannot be considered a signal of a trend reversal. Currently, there is a good chance of starting a bullish correction (since the price has been falling for seven or eight days), but we do not see specific buy signals. It's also worth taking note that in a flat market, the lines of the Ichimoku indicator lose their strength. Therefore, we can't consider it a buy signal even if the pair does overcome the Kijun-sen.
The good news is as follows. This week will bring a large number of important events and reports, so the pair is unlikely to stand still. Most likely, we simply witnessed another "boring Monday," but the flat will end very quickly. The US will release crucial inflation data today, and all three central bank meetings will be held on Wednesday and Thursday. Therefore, this week's volatility may be strong enough.
Speaking of trading signals, the pair generated two on Monday. First, the pair bounced off the level of 1.0757, then settled below it. However, since there was a clearly defined flat, both of these signals could not even .trigger a 15-pip movement. We already warned you that traders should not expect strong movements or trends on Monday.
COT report:
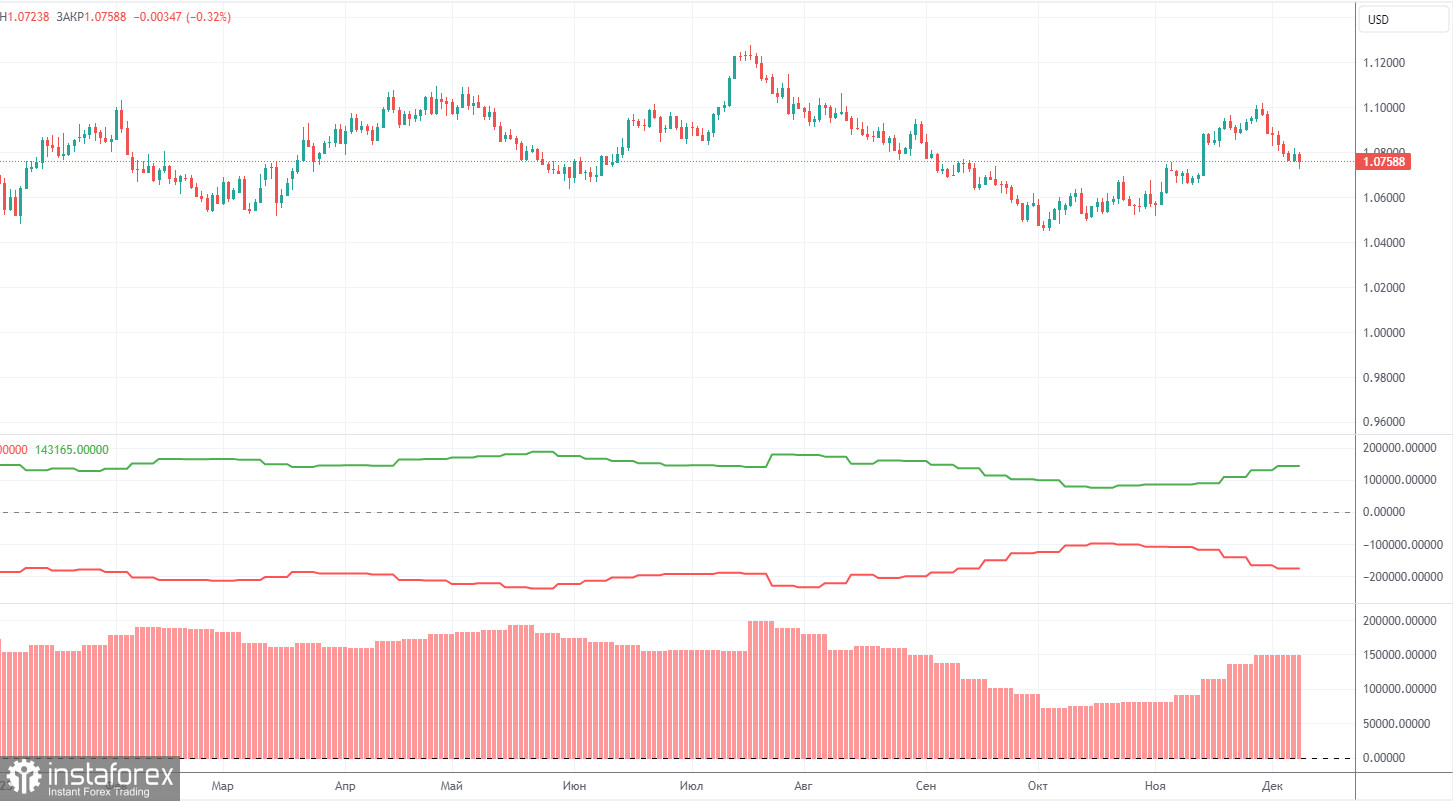
The latest COT report is dated December 5. Over the past 12 months, the COT report data has been consistent with what's happening in the market. The net position of large traders (the second indicator) began to rise back in September 2022, roughly at the same time that the euro started to rise. In the first half of 2023, the net position hardly increased, but the euro remained relatively high during this period. In the last three months, we have seen a decline in the euro and a drop in the net position, as we anticipated. However, in the last few weeks, both the euro and the net position have been rising. Therefore, we can draw a clear conclusion: the pair is correcting higher, but the correction cycle may have finally come to an end.
We have previously noted that the red and green lines have moved significantly apart from each other, which often precedes the end of a trend. Currently, after a small correction, these lines are diverging again. Therefore, we stick to the scenario that the upward trend should come to an end. During the last reporting week, the number of long positions for the "non-commercial" group increased by 2,200, while the number of short positions fell by 6,900. Consequently, the net position increased by 9,100. The number of BUY contracts is still higher than the number of SELL contracts among non-commercial traders by 152,000. In principle, it is now evident even without COT reports that the euro should continue to fall.
Analysis of EUR/USD 1H
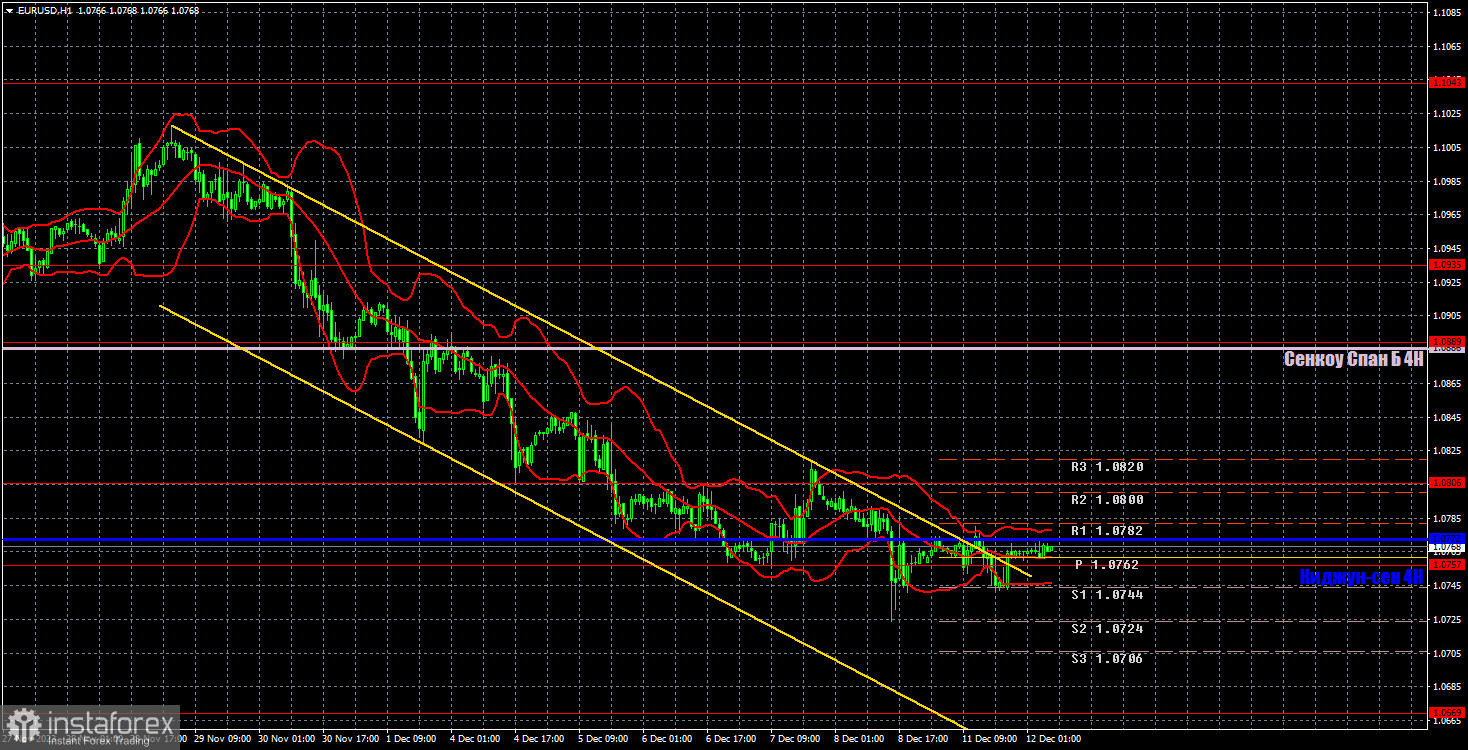
On the 1-hour chart, the pair continues to trade lower, as expected over the past few weeks. Currently, the euro is falling almost every day, as it hardly pays attention to the US reports that elevated it to a pedestal two weeks ago. An upward retracement is possible at the moment, but everything will depend on this week's events.
At the moment, we can only recommend selling. If the pair consolidates above the Kijun-sen line, it will be a formal signal for a bullish correction. If the price remains below the critical line, then you may consider selling with 1.0669 as the target.
On December 12, we highlight the following levels for trading: 1.0530, 1.0581, 1.0658-1.0669, 1.0757, 1.0806, 1.0889, 1.0935, 1.1043, 1.1092, 1.1137, as well as the Senkou Span B (1.0886) and Kijun-sen (1.0772) lines. The Ichimoku indicator lines can shift during the day, so this should be taken into account when identifying trading signals. There are also auxiliary support and resistance levels, but signals are not formed near them. Signals can be "bounces" and "breakouts" of extreme levels and lines. Don't forget to set a breakeven Stop Loss if the price has moved in the right direction by 15 pips. This will protect against potential losses if the signal turns out to be false.
On Tuesday, we can expect secondary reports from the ZEW Institute for the euro area and Germany, which are unlikely to attract strong interest. Market participants will keep an eye on the US inflation report, and we recommend focusing entirely on that.
Description of the chart:
Support and resistance levels are thick red lines near which the trend may end. They do not provide trading signals;
The Kijun-sen and Senkou Span B lines are the lines of the Ichimoku indicator, plotted to the 1H timeframe from the 4H one. They provide trading signals;
Extreme levels are thin red lines from which the price bounced earlier. They provide trading signals;
Yellow lines are trend lines, trend channels, and any other technical patterns;
Indicator 1 on the COT charts is the net position size for each category of traders;
Indicator 2 on the COT charts is the net position size for the Non-commercial group.


