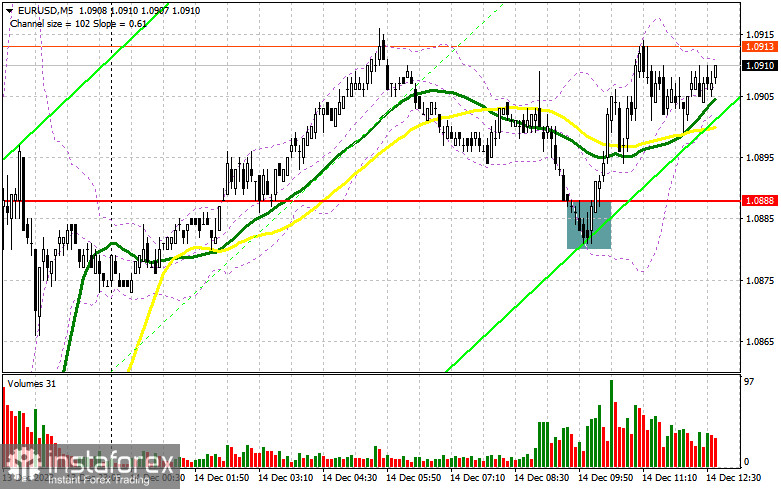
In my morning forecast, I highlighted the level of 1.0888 and recommended making trading decisions based on it. Let's take a look at the 5-minute chart and analyze what happened there. The decline and the formation of a false breakout at this level resulted in an excellent buying signal in the continuation of the bullish trend. As a result, the pair grew by more than 30 points. The technical picture for the second half of the day was only slightly revised.

To open long positions on EUR/USD, the following is required:
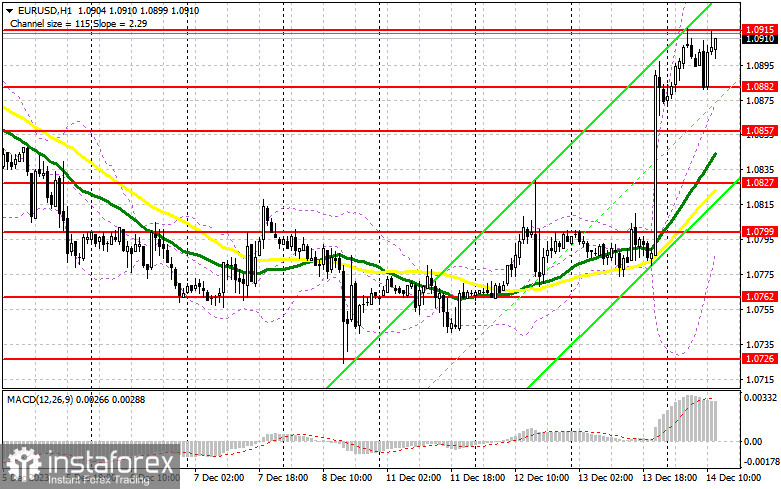
Now everything depends on the crucial decision of the European Central Bank regarding interest rates, which I discussed in more detail in my morning forecast, so there is no need to repeat it. In addition to the ECB decision, we are also awaiting figures on changes in retail sales volume in the United States and the number of initial claims for unemployment benefits. If retail sales disappoint, the euro will continue its active growth, which I suggest taking advantage of. The most optimal scenario remains to buy around the morning support of 1.0888, which has transformed into 1.0882, and I advise paying attention to this. A false breakout there will provide an entry point for long positions with the expectation of a recovery in EUR/USD and a test of the resistance at 1.0915, formed after yesterday's American session. Breaking through 1.0915 and updating from top to bottom, along with the ECB's firm position on future policy, will signal a buy and a chance to update to 1.0947. The ultimate target will be the area of 1.0979, where I will take profit. In the case of a decline in EUR/USD and the absence of activity at 1.0882 in the second half of the day, as well as strong US statistics, a downward correction can be expected. In this case, I plan to enter the market only after a false breakout is formed around 1.0857. I will consider opening long positions immediately on the rebound from 1.0827 with the target of an upward correction within the day by 30-35 points.
To open short positions on EUR/USD, the following is required:
Sellers are facing challenges, and all hope lies only in the dovish rhetoric of the ECB. Trading against such a bullish market is not the most successful idea, but the formation of a false breakout around 1.0915 will confirm the right selling point and provide a signal to update 1.0882 – the support that sellers stumbled upon once today. Only after breaking through and consolidating below this range, as well as a bottom-up retest, do I expect to receive another sell signal with a target of at least 1.0827, where I will take profit. In the event of an upward movement of EUR/USD during the American session, the absence of bears at 1.0915, as well as Christine Lagarde's strong comments, buyers will retain the initiative. This will open the way to 1.0947, where selling is also possible, but only after an unsuccessful consolidation. I will consider opening short positions immediately on the rebound from 1.0979 with the target of a downward correction by 30-35 points.


Indicator signals:
Moving Averages
Trading is conducted above the 30 and 50-day moving averages, indicating a bullish market.
Note: The period and prices of the moving averages are considered by the author on the hourly chart H1 and differ from the general definition of classical daily moving averages on the daily chart D1.
Bollinger Bands
In case of a decline, the lower boundary of the indicator will act as support in the area of 1.0800.
Indicator Descriptions:
- Moving Average (MA): Determines the current trend by smoothing volatility and noise. Period 50 is marked in yellow on the chart. Period 30 is marked in green on the chart.
- Moving Average Convergence/Divergence (MACD): Fast EMA period 12, Slow EMA period 26, SMA period 9.
- Bollinger Bands: Period 20.
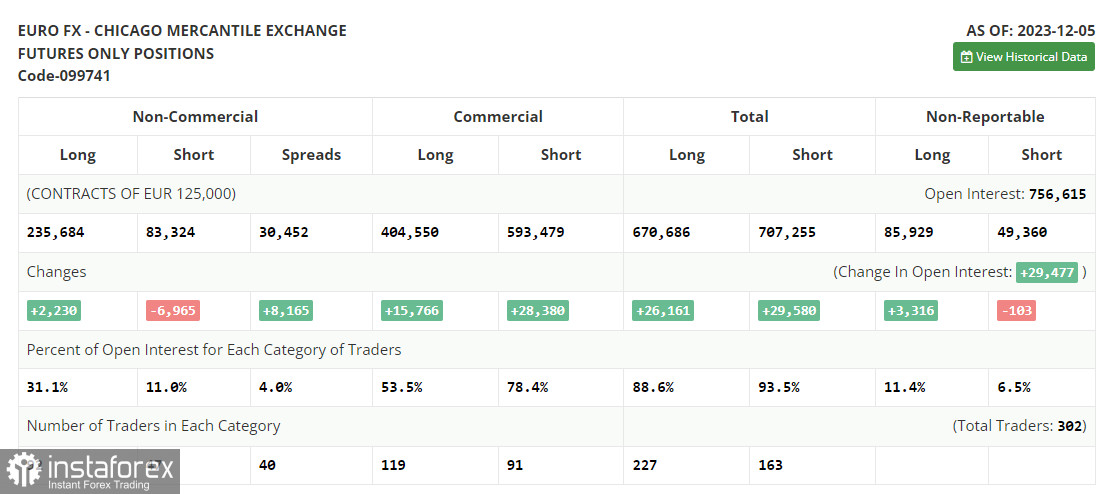
- Non-commercial Traders: Speculators, such as individual traders, hedge funds, and large institutions use the futures market for speculative purposes and meet certain requirements.
- Long Non-commercial Positions: The total long open position of non-commercial traders.
- Short Non-commercial Positions: The total short open position of non-commercial traders.
- The total non-commercial net position is the difference between the short and long positions of non-commercial traders.


