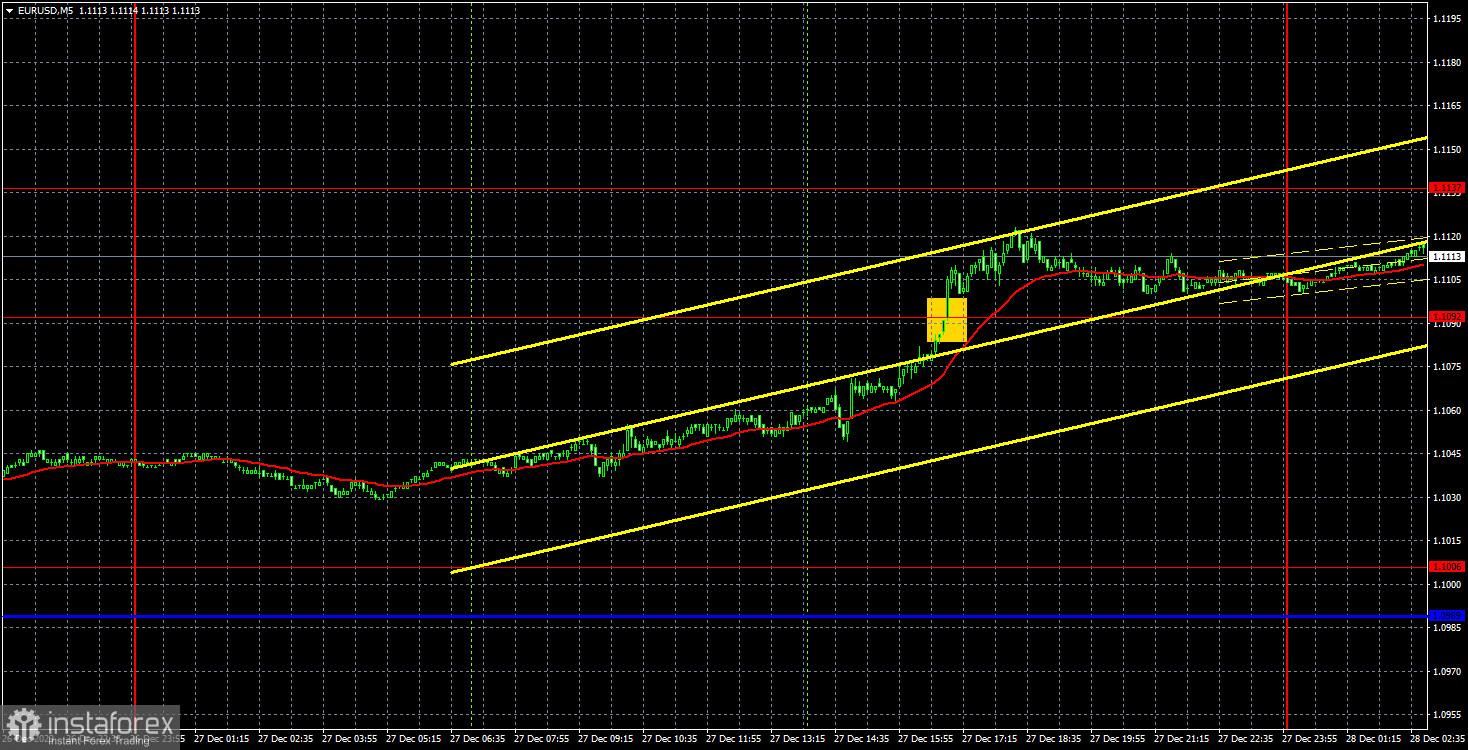
Analysis of EUR/USD 5M

On Tuesday, the EUR/USD currency pair remained virtually unchanged for most of the day, surging by 100 points on Wednesday. This increase occurred without macroeconomic or fundamental support, seemingly out of nowhere. Such is the nature of this holiday week. Over the weekend, we warned that movements might be illogical and chaotic. The pair needed clearer logic even before the start of this week, and the lack of logic has only increased. While the euro was rising and the dollar was falling in the past, allowing for some explanation of the pair's movement, it's even more challenging to describe what's happening in the forex market now.
Nevertheless, we still have an ascending channel that supports the current upward trend from a technical perspective. Technically, the movement to the north is entirely logical and raises no questions. In the absence of fundamental data and macroeconomics, the market is trading purely based on technical factors. Consequently, buying remains more promising than selling.
Throughout the day yesterday, only one buy signal was generated. Of course, you could have bought the pair after it crossed the 1.1006 level, as there are currently no significant corrections or pullbacks, and the price overcomes one level after another. However, traders could have earned about 20–30 points based on yesterday's signal, which formed quite late.
COT Report
The latest COT report is dated December 19. In the first half of 2023, commercial traders' net position hardly increased, but the euro remained relatively high during this period. Then, there was a drop in the euro and a decline in the net position, as we expected. However, in recent weeks, the euro and the net position have risen. Therefore, we draw a clear conclusion: the pair is correcting upward, but this correction cannot last forever because it is a correction.
We have previously pointed out to traders that the red and green lines have diverged significantly from each other, often preceding the end of a trend. Currently, these lines are once again moving apart. Therefore, we still favor a decline in the European currency and the end of the upward movement. During the last reporting week, the number of longs among "non-commercial" traders decreased by 23.8 thousand, while the number of shorts increased by 8.9 thousand. Consequently, the net position decreased by 32.7 thousand. The number of buy contracts is higher than the number of sell contracts among non-commercial traders by 115 thousand. The gap is significant, and even without COT reports, it is clear that the European currency should continue to fall.
Analysis of EUR/USD 1H
The pair continues its strong and stable northward movement in the hourly timeframe. The euro has risen very high but continues to rise more often than it falls, despite the lack of significant fundamental reasons. Therefore, for now, trading with the trend is the only option. The ascending channel visualizes what is happening in the market.
Today, we consider it appropriate to stay in long positions with targets at 1.1137 and 1.1185, as it has crossed the 1.1006 level. Wednesday showed us that the European currency is in demand even during the holidays. If you desire to trade during the holidays, buying is currently relevant. Sales will be possible after the price consolidates below the Kijun-sen line and the ascending channel, with targets at 1.0935 and 1.0889. This week, volatility may be very low, which should be considered when opening positions.
On December 28, we highlight the following levels for trading: 1.0658-1.0669, 1.0757, 1.0818, 1.0889, 1.0935, 1.1006, 1.1092, 1.1137, 1.1185, 1.1234, 1.1274, as well as the Senkou Span B (1.0867) and Kijun-sen (1.1026) lines. The Ichimoku indicator lines may move during the day, so consider this when determining trading signals. Remember to place a Stop Loss order at breakeven if the price moves in the right direction by 15 points. This will protect against potential losses if the signal turns out to be false.
On Thursday, as throughout this week, there won't be any significant events or publications. Therefore, we expect a flat market and low volatility, but the euro currency may continue to rise.
Explanations for the illustrations:
Support and resistance levels - thick red lines near which movement may end. They are not sources of trading signals;
Kijun-sen and Senkou Span B lines - lines of the Ichimoku indicator transferred from a 4-hour timeframe to an hourly one. They are strong lines;
Extreme levels - thin red lines from which the price has bounced before. They are sources of trading signals;
Yellow lines - trendlines, trend channels, and any other technical patterns;
Indicator 1 on COT charts - the size of the net position for each category of traders;
Indicator 2 on COT charts - the size of the net position for the Non-commercial group.


