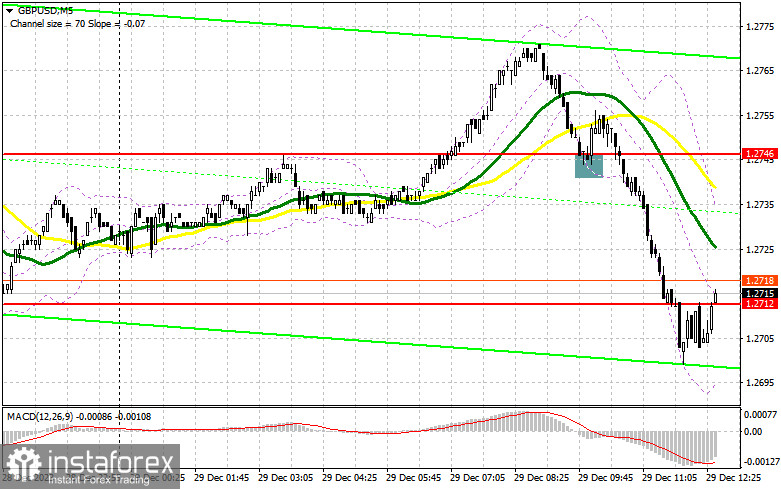
In my morning forecast, I drew attention to the level of 1.2746 and planned to make decisions regarding market entry based on it. Let's look at the 5-minute chart and analyze what happened there. The decline and the formation of a false breakout at this level initially signaled a buying opportunity for the pound. However, after moving up by 10 points, the pressure on the pair returned. The technical picture was slightly revised for the second half of the day.

To open long positions on GBP/USD, the following conditions are required:
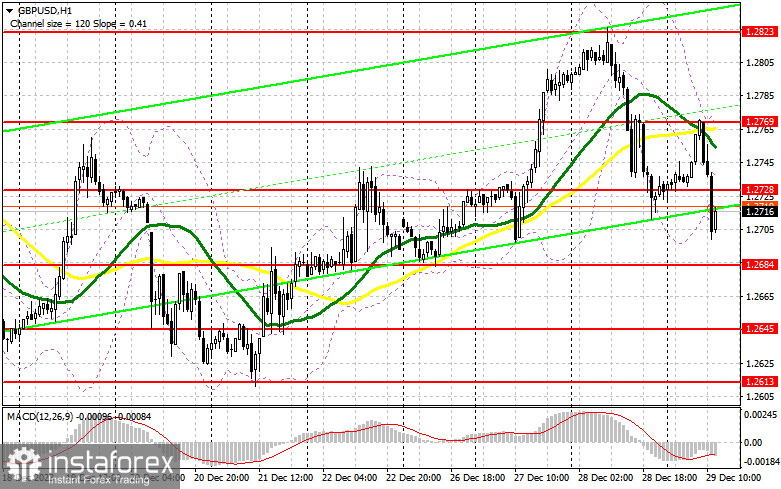
Ahead of us, there is data on the Chicago PMI index, where a slowdown in activity is expected. This could maintain pressure on the dollar. I will only consider buying after a decline towards the new support level of 1.2684, which we did not reach in the first half of the day. Only a false breakout there will provide a suitable entry point for long positions, from which the upward movement should be quite swift towards 1.2728, the new resistance formed during European trading. Breaking through and establishing above this level will revive demand for the pound and open the path to 1.2769, where moving averages are located. The ultimate target is the area around 1.2823, where I plan to make a profit. In the scenario of a pair's decline and the absence of bullish activity at 1.2684 in the second half of the day, things will turn unfavorable for buyers, and the pressure on the pound will increase even further. In this case, I will postpone purchases until the next support at 1.2645. I intend to buy GBP/USD immediately on a bounce only from 1.2613, with a 30-35 point intraday correction target.
To open short positions on GBP/USD, the following conditions are required:
Sellers retain control over the market, and now the crucial thing is to demonstrate strength around 1.2728. Protecting this range after strong US data will provide a short entry point with the prospect of returning to 1.2684. Breaking through and retesting this range from below to above will inflict a more serious blow to bullish positions, leading to stop-loss triggering and opening the path to 1.2645, where buyers will become more active. The ultimate target will be the area around 1.2613, where I plan to make a profit. In the scenario of GBP/USD rising and the absence of activity at 1.2728, buyers will manage to restore the market balance at the end of the year. In this case, I will postpone selling until a false breakout at 1.2769. In case of no downward movement there, I will sell GBP/USD immediately on a bounce from 1.2823, but only counting on a pair's correction of 30-35 points intraday.

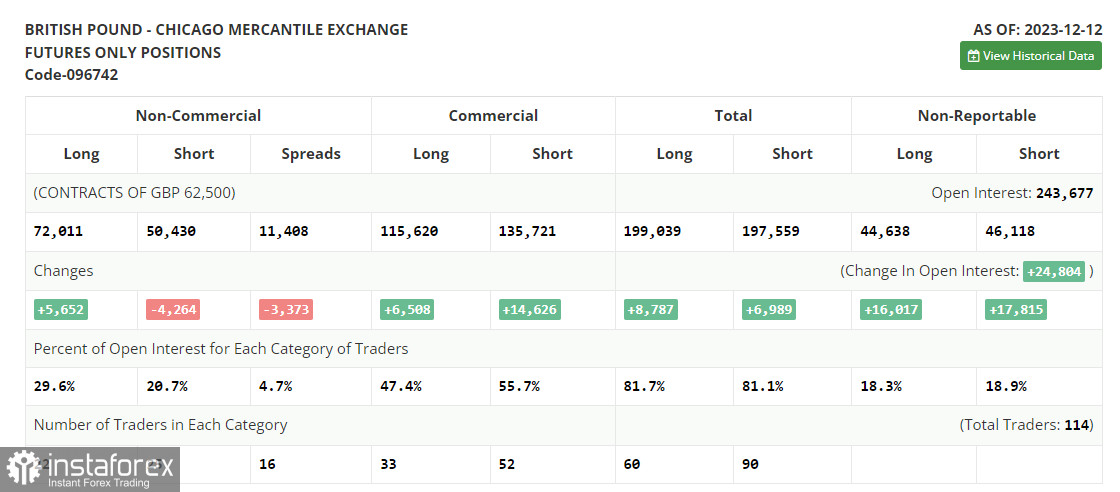
In the COT report (Commitment of Traders) for December 12th, there was a sharp increase in long positions and a decrease in short ones. Demand for the pound persists, as the recent decision by the Bank of England to keep rates unchanged in anticipation of further efforts to combat high inflation and the statements by Bank of England Governor Andrew Bailey that rates will remain high for an extended period have boosted the pound and led to its strengthening against the US dollar. However, the question is how the UK economy, facing significant difficulties lately, will continue to react to all this. In the near future, a batch of data on inflation in the UK and the US will be released, and in case of rising prices, we can expect the pair to strengthen further. In the latest COT report, it is mentioned that long non-commercial positions increased by 5,652 to the level of 72,011, while short non-commercial positions dropped by 4,264 to the level of 50,430. As a result, the spread between long and short positions decreased by 3,373.

Indicator Signals:
Moving Averages
Trading is conducted below the 30 and 50-day moving averages, indicating further downward movement for the pair.
Note: The author considers the period and prices of moving averages on the H1 hourly chart and differs from the general definition of classic daily moving averages on the D1 daily chart.
Bollinger Bands
In case of a decline, the lower boundary of the indicator, around 1.2720, will serve as support.
Indicator Descriptions:
- Moving Average (determines the current trend by smoothing volatility and noise). Period 50. Marked in yellow on the chart.
- Moving Average (determines the current trend by smoothing volatility and noise). Period 30. Marked in green on the chart.
- MACD indicator (Moving Average Convergence/Divergence – measures the relationship between two moving averages of the asset's price). Fast EMA period 12. Slow EMA period 26. SMA period 9.
- Bollinger Bands (a volatility indicator consisting of three lines, an upper, middle, and lower band). Period 20.
- Non-commercial traders - speculators such as individual traders, hedge funds, and large institutions using the futures market for speculative purposes and meeting certain requirements.
- Long non-commercial positions represent the total long open positions of non-commercial traders.
- Short non-commercial positions represent the total short open positions of non-commercial traders.
- The total non-commercial net position is the difference between non-commercial traders' short and long positions.


