


Analyzing Thursday's trades:
EUR/USD on 1H chart
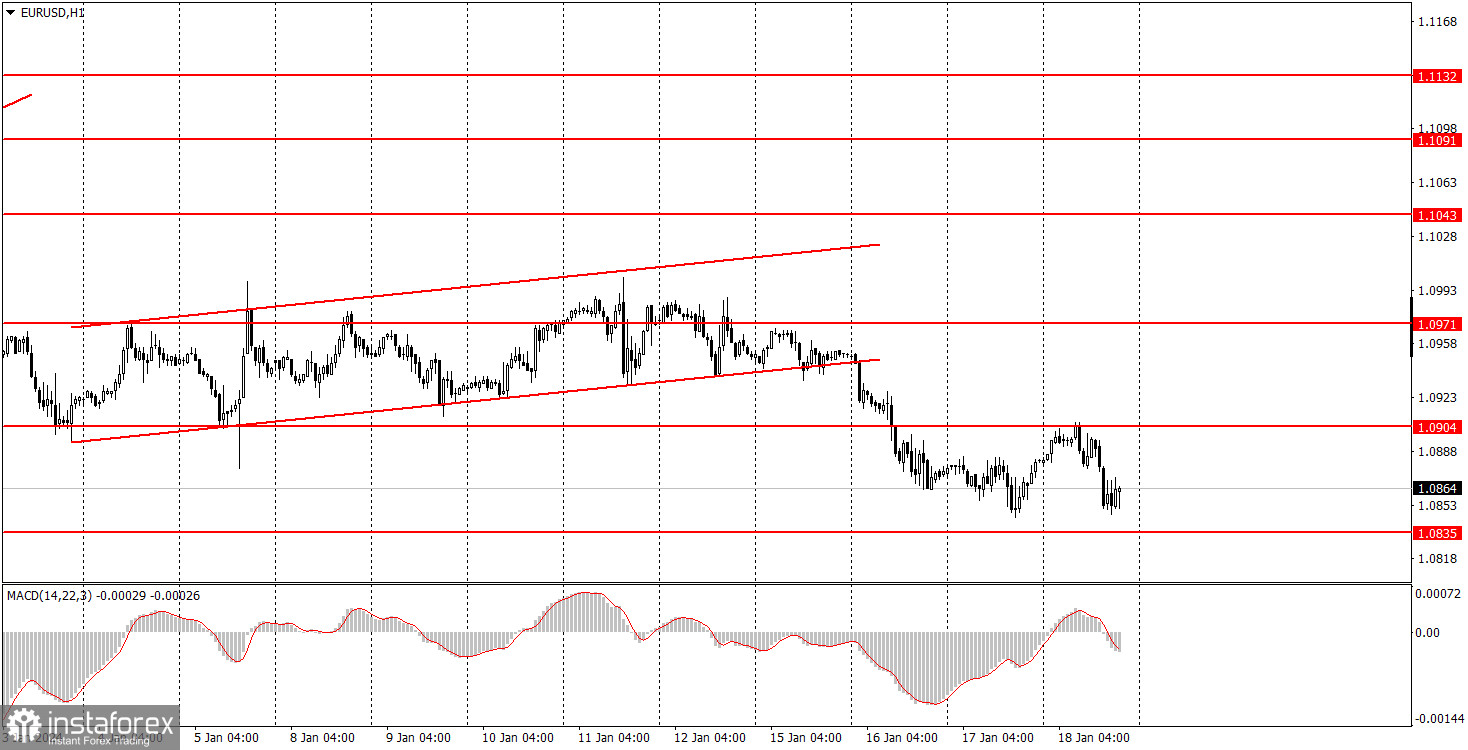
EUR/USD traded lower on Thursday, which is in line with our expectations. The euro fell for a reason. Three secondary reports released at the beginning of the US trading session, which initially had very low chances of influencing market sentiment. However, all three turned out to be in favor of the US dollar, which strengthened the greenback. However, the reports were so weak that the dollar only gained around 20 pips in total, and the overall volatility of the day was about 60 pips. Nevertheless, the dollar grew, which is a positive sign because, as a reminder, we expect the pair to fall to around 1.02.
From a technical perspective, the movements were also ideal. The price had previously settled below the ascending channel, indicating a shift to a downtrend. On Thursday, the price bounced off the nearest resistance level at 1.0904, indicating that the pair was expected to resume the downward movement. The market is gradually giving up the idea that the Federal Reserve will start lowering interest rates immediately, and the European Central Bank will do so sometime in the future. Therefore, the euro is starting to lose support.
EUR/USD on 5M chart
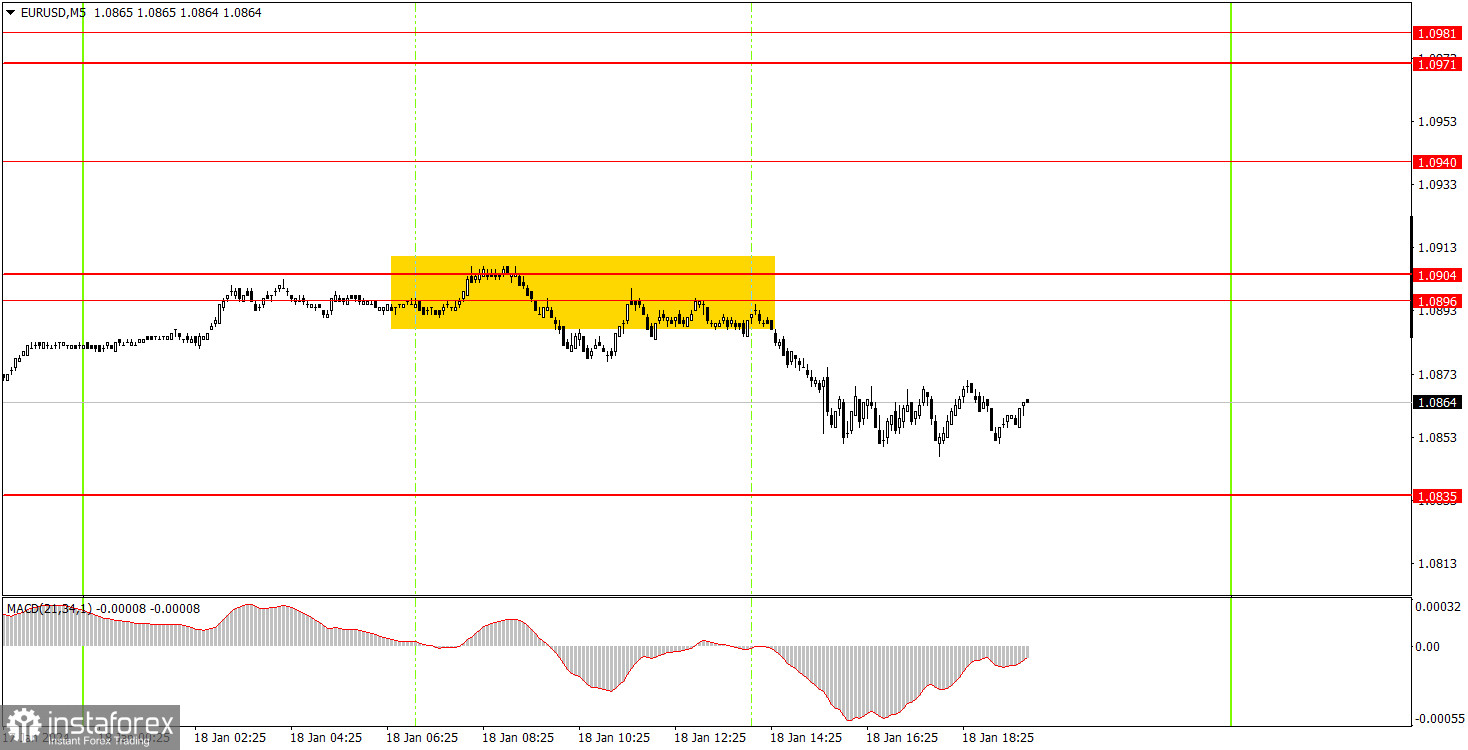
Several trading signals were formed on the 5-minute chart, but they all duplicated each other, so we combined them into one. The price bounced from the area of 1.0896-1.0904 (as we warned) several times, afterwards it managed to fall by about 30 pips. Beginners could have earned these 30 pips because there were no buy signals until late in the evening, so there was no reason to close short positions earlier.
Trading tips on Friday:
On the hourly chart, EUR/USD finally has a good chance to form a downtrend, as it has settled below the ascending channel. Perhaps the market has finally changed its attitude towards the euro and the dollar to the opposite, so the pair should continue to fall by another 500-600 pips.
We will expect further downward movement since several sell signals were formed around the area of 1.0896-1.0904 this week. Therefore, we consider it reasonable to stay in short positions with a target of at least 1.0835. In the long run, we expect a much stronger decline in the pair.
The key levels on the 5M chart are 1.0733, 1.0767-1.0781, 1.0835, 1,0896-1,0904, 1.0940, 1.0971-1.0981, 1.1011, 1.1043, 1.1091, 1.1132-1.1145, 1.1184, 1.1241, 1.1279-1.1292. On Friday, ECB President Christine Lagarde is set to deliver a speech again. She has already spoken twice this week. On the US docket, only the University of Michigan Consumer Sentiment Index is on the agenda. Since Lagarde was quite restrained in her statements earlier this week, we do not expect any major speeches from her on Friday. Nevertheless, the euro may edge down as the market begins to lose faith in the eurozone.
Basic trading rules:
1) Signal strength is determined by the time taken for its formation (either a bounce or level breach). A shorter formation time indicates a stronger signal.
2) If two or more trades around a certain level are initiated based on false signals, subsequent signals from that level should be disregarded.
3) In a flat market, any currency pair can produce multiple false signals or none at all. In any case, the flat trend is not the best condition for trading.
4) Trading activities are confined between the onset of the European session and mid-way through the U.S. session, after which all open trades should be manually closed.
5) On the 30-minute timeframe, trades based on MACD signals are only advisable amidst substantial volatility and an established trend, confirmed either by a trendline or trend channel.
6) If two levels lie closely together (ranging from 5 to 15 pips apart), they should be considered as a support or resistance zone.
How to read charts:
Support and Resistance price levels can serve as targets when buying or selling. You can place Take Profit levels near them.
Red lines represent channels or trend lines, depicting the current market trend and indicating the preferable trading direction.
The MACD(14,22,3) indicator, encompassing both the histogram and signal line, acts as an auxiliary tool and can also be used as a signal source.
Significant speeches and reports (always noted in the news calendar) can profoundly influence the price dynamics. Hence, trading during their release calls for heightened caution. It may be reasonable to exit the market to prevent abrupt price reversals against the prevailing trend.
Beginning traders should always remember that not every trade will yield profit. Establishing a clear strategy coupled with sound money management is the cornerstone of sustained trading success.


