


Analyzing Thursday's trades:
GBP/USD on 1H chart
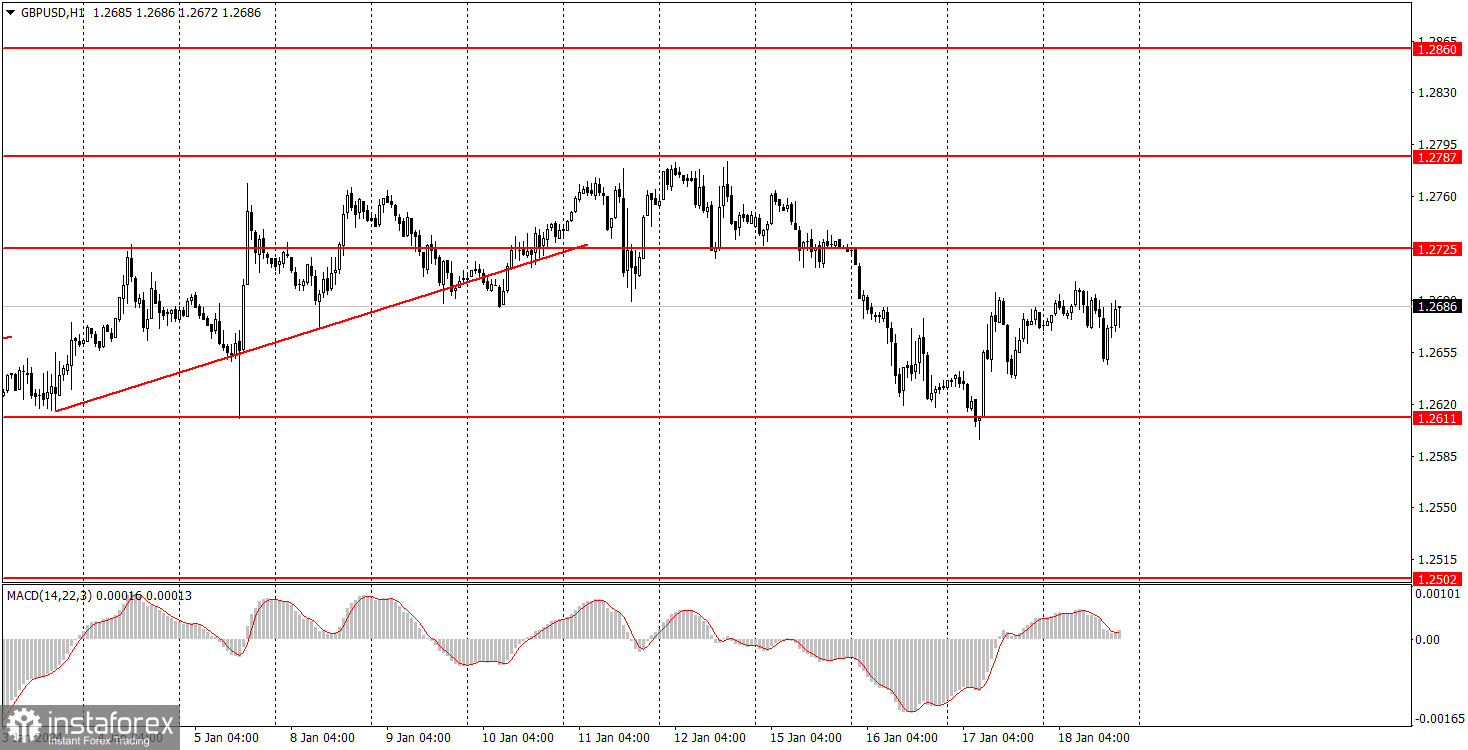
The GBP/USD pair attempted to resume its downward movement on Thursday but failed. We have repeatedly pointed out that the euro and the pound are currently trading very differently. The euro is following a downtrend, albeit not a strong one, while the pound has been trading in a sideways channel between the levels of 1.2611 and 1.2787 for a month. Therefore, the nature of movement in these currency pairs is entirely different. For the pound, macroeconomic and fundamental events currently have a very indirect impact. The price is in a flat range and, for the most part, moves from one border to another of the sideways channel. That pretty much sums it up.
We expect a pronounced decline in the pound, but take note that the Bank of England is firmly maintaining its stance and shows no signs of preparing to soften its rhetoric regarding the key interest rate. Therefore, the market anticipates a near-term interest rate cut in the United States, a slightly later rate cut in the European Union, and no expectations of rate cuts in the UK, as inflation remains twice as high as the target level. This is presumably providing support to the British currency. It may not have enough strength for a new rise, but it is enough to prevent a decline.
GBP/USD on 5M chart
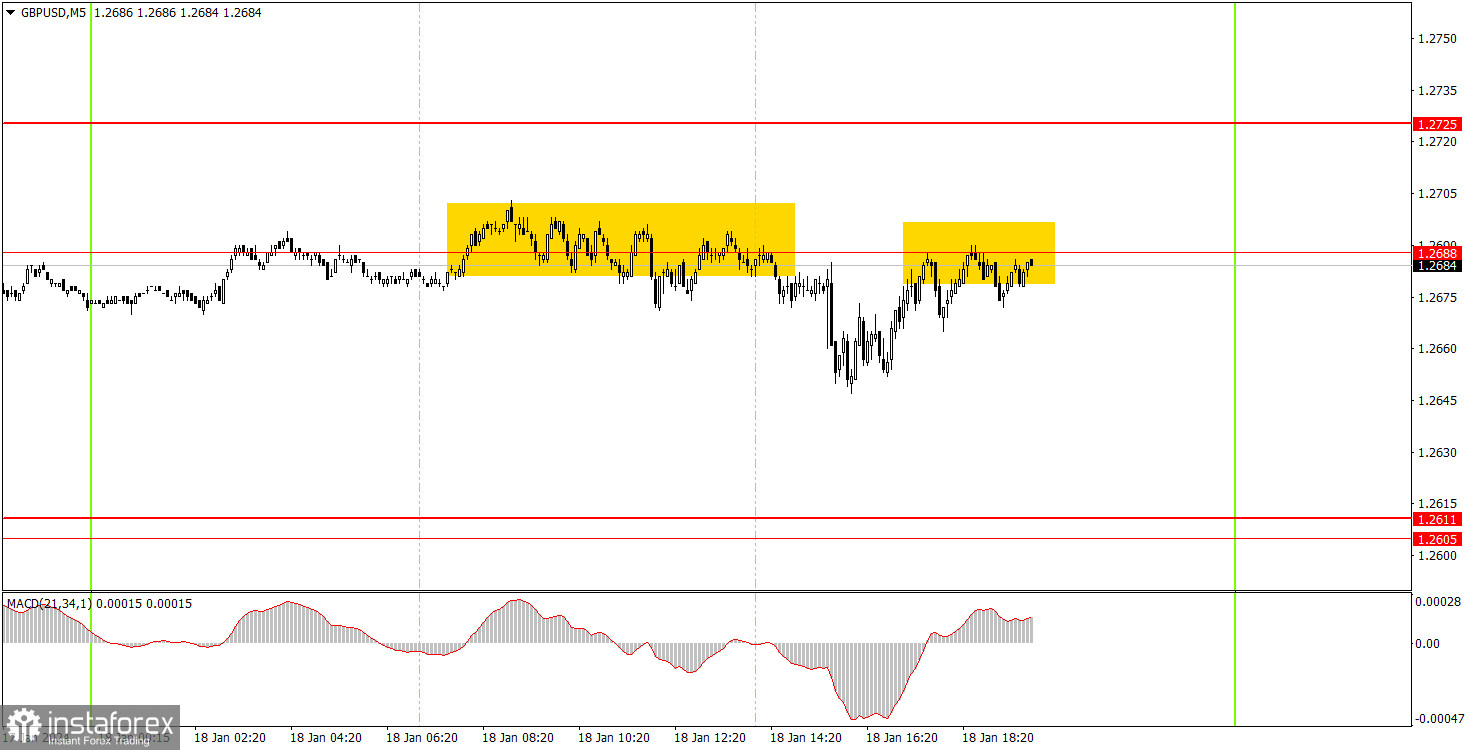
The pair's movements on the 5-minute timeframe were not the best. For most of the day, the GBP/USD pair was near the 1.2688 level, and it was only at the beginning of the US session (when reports on initial jobless claims, building permits, and housing starts were released) that the dollar sharply strengthened by about 30 pips. However, the price quickly returned to its initial positions, and the market reaction was not very strong. Consequently, several sell signals were generated, none of which could cause losses, as the price never managed to stay above the 1.2688 level and never formed a buy signal. To be fair, take note that it was very difficult to make profit from these signals.
Trading tips on Friday:
On the hourly chart, GBP/USD is still trading within the sideways channel of 1.2611-1.2787. The price has rebounded from the 1.2611 level for the fifth consecutive time, so a new phase of growth within the flat range has begun, which is clearly visible on the 4-hour chart. Now the price can continue to gradually rise towards the upper band of the sideways channel.
On Friday, there's a good chance that the British pound will remain within the sideways channel. There will be no significant fundamental or macroeconomic events in either the US or the UK, so it will be quite difficult to expect strong growth or decline. The price is almost in the middle of the channel, so the chances of breaking out of it are low.
The key levels on the 5M chart are 1.2270, 1.2310, 1.2372-1.2387, 1.2457, 1.2502, 1.2544, 1.2605-1.2611, 1.2688, 1.2725, 1.2787-1.2791, 1.2848-1.2860, 1.2913, 1.2981-1.2993. On Friday, the UK will release a retail sales report, and the US will release the University of Michigan Consumer Sentiment Index. Both reports are secondary of importance, so the market reaction is expected to be weak.
Basic trading rules:
1) Signal strength is determined by the time taken for its formation (either a bounce or level breach). A shorter formation time indicates a stronger signal.
2) If two or more trades around a certain level are initiated based on false signals, subsequent signals from that level should be disregarded.
3) In a flat market, any currency pair can produce multiple false signals or none at all. In any case, the flat trend is not the best condition for trading.
4) Trading activities are confined between the onset of the European session and mid-way through the U.S. session, after which all open trades should be manually closed.
5) On the 30-minute timeframe, trades based on MACD signals are only advisable amidst substantial volatility and an established trend, confirmed either by a trendline or trend channel.
6) If two levels lie closely together (ranging from 5 to 15 pips apart), they should be considered as a support or resistance zone.
How to read charts:
Support and Resistance price levels can serve as targets when buying or selling. You can place Take Profit levels near them.
Red lines represent channels or trend lines, depicting the current market trend and indicating the preferable trading direction.
The MACD(14,22,3) indicator, encompassing both the histogram and signal line, acts as an auxiliary tool and can also be used as a signal source.
Significant speeches and reports (always noted in the news calendar) can profoundly influence the price dynamics. Hence, trading during their release calls for heightened caution. It may be reasonable to exit the market to prevent abrupt price reversals against the prevailing trend.
Beginners should always remember that not every trade will yield profit. Establishing a clear strategy coupled with sound money management is the cornerstone of sustained trading success.


