


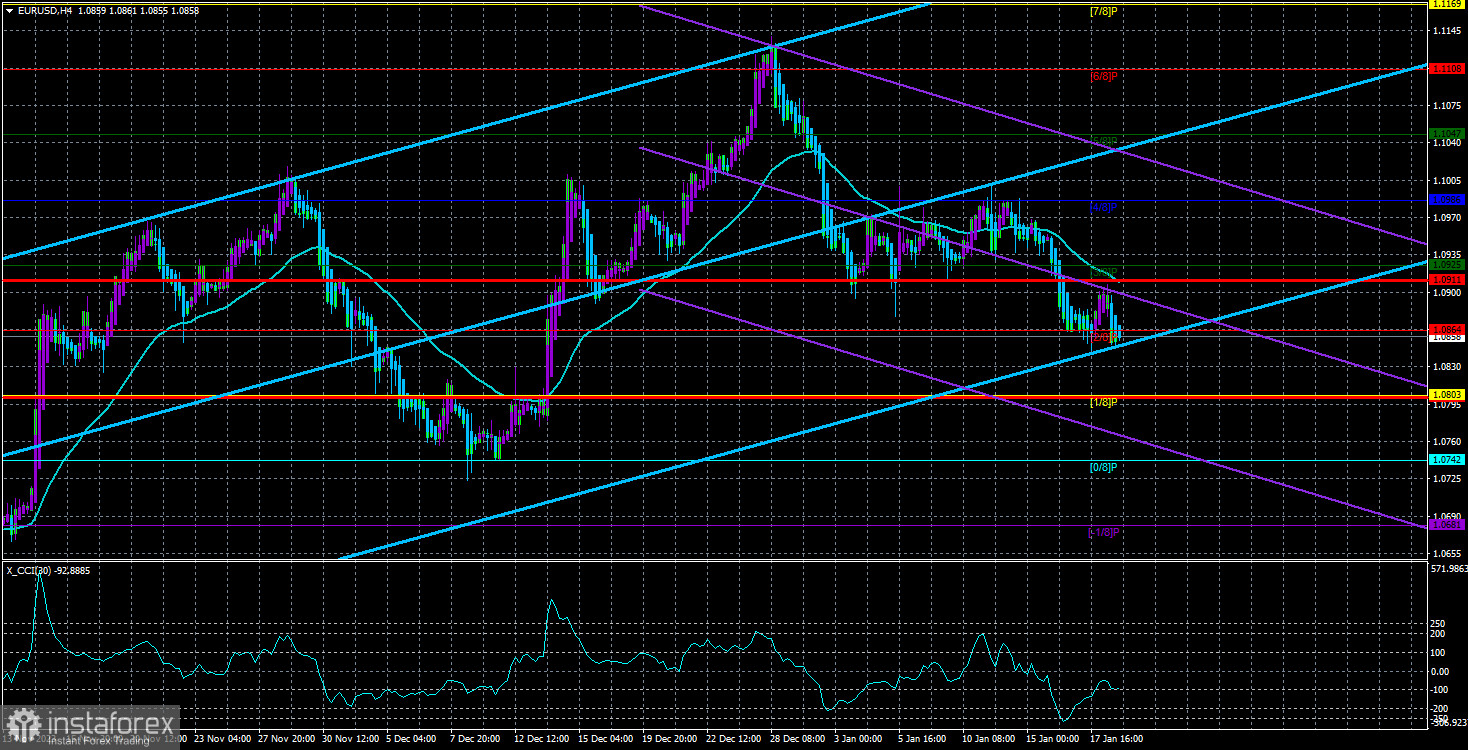
The EUR/USD currency pair continued to trade with low volatility and extreme caution on Thursday. During the European trading session, there was almost no movement, but the American market began to show slightly more activity. From a technical standpoint, the EUR/USD pair's outlook remains unchanged as the price continues to trade below the moving average line. Therefore, as before, we continue to anticipate a more significant decline in the euro.
Yesterday was quite uneventful in terms of macroeconomic and fundamental developments. Publications were local, and the statements from officials of the ECB and the Fed were more confusing than providing answers to the questions at hand. Summarizing the statements of European and American officials related to central banks, the following picture emerges:
The Fed is likely to lower interest rates for the first time in May 2024. We understand that the market is anticipating the first rate cut in March, but the tone of the Fed officials' statements is much more cautious. Fed policymakers believe that there is no rush to lower the key interest rate, and the market expects too much from the regulator this year. Therefore, it can be assumed that there will be 4-5 rate cuts, but no more.
We also want to remind you that the impact of inflation on the Fed's monetary policy has not disappeared. If inflation continues to rise in the coming months, what talk of monetary policy easing can there be? Additionally, the U.S. economy allows the Fed to maintain the rate at its maximum level for a much longer period than the market currently anticipates. Unemployment has increased minimally over the past year, the labor market is strong and stable, and the economy is not just growing but accelerating. Why take the risk of premature policy easing when you can wait a few more months?
As for the ECB, most analysts agree that the first-rate cut can be expected in June, at the end of the second quarter. We believe that it will also depend on inflation, which cannot be forecasted accurately 4-5 months ahead.
Therefore, both central banks will closely monitor macroeconomic data and act based on incoming information. Certainly, there must be some basic forecast to guide everyone. At the moment, it is as follows: the Fed lowers rates in March and the ECB in June. However, in reality, the timing of the first rate cut in the U.S. may push one meeting forward, and in the EU, one meeting backward. It is hardly possible for anyone to deny that this is quite possible.
Representatives of the Fed and the ECB have not specified their plans and expectations, so there can be no precision on this matter. Nevertheless, we believe that the market has started to become more flexible in its outlook on interest rates in 2024. The European currency declined in January, indicating that the market allows for a more hawkish approach by the Fed and a more dovish approach by the ECB. As for the January meetings, no rate cuts are expected from either the ECB or the Fed.
We believe that the European currency has the potential to continue its decline against the dollar until the January meetings. In the medium term, we also expect a decline in the European currency. What we do not expect is a resumption of the annual uptrend.
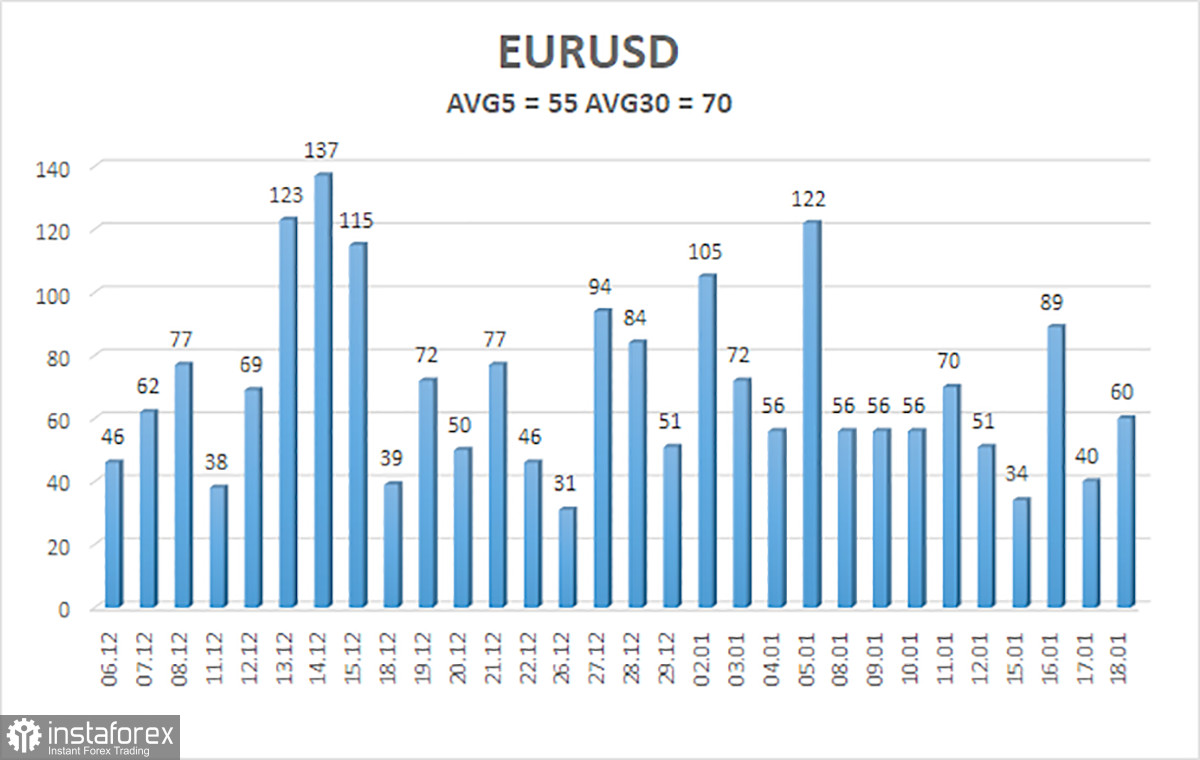
The average volatility of the EUR/USD currency pair over the last 5 trading days as of January 19th is 55 points and is characterized as "average." Therefore, we expect the pair to move between the levels of 1.0802 and 1.0911 on Friday. A reversal of the Heiken Ashi indicator upward will indicate a new phase of the upward correction.
Nearest support levels:
S1 - 1.0803
S2 - 1.0742
S3 - 1.0681
Nearest resistance levels:
R1 - 1.0864
R2 - 1.0925
R3 - 1.0986
Explanations for the illustrations:
Linear regression channels - help determine the current trend. If both channels are pointing in the same direction, it means the trend is currently strong.
The moving average line (settings 20.0, smoothed) - determines the short-term trend and direction for trading.
Murray levels - target levels for movements and corrections.
Volatility levels (red lines) - the likely price channel where the pair will move over the next day based on current volatility indicators.
CCI indicator - its entry into the overbought area (above +250) or oversold area (below -250) indicates that a trend reversal in the opposite direction is approaching.


