The strong bullish momentum that emerged at the beginning of the week for the dollar, triggered by the sharp escalation of the geopolitical situation in the Middle East and the Red Sea region, seems to be gradually fading. However, a new escalation in the conflict in Gaza or a fresh exchange of hostilities between the United States and the Houthi rebels could once again spark interest in the safe-haven dollar. It is not excluded that Monday may open with another gap in such a scenario.

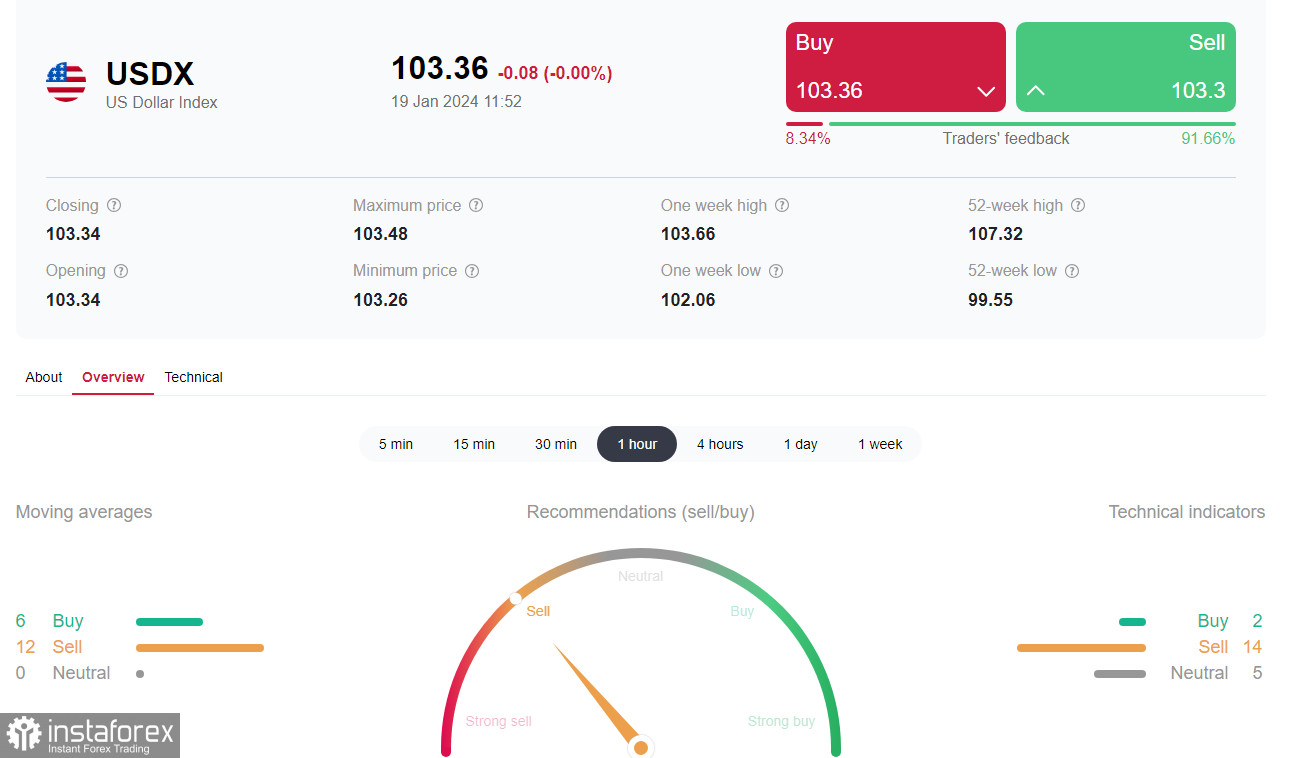
At the end of the week, the U.S. Dollar Index (DXY) remains within a range, currently trading slightly above (by 16 points) the level of 103.00 as of this writing.
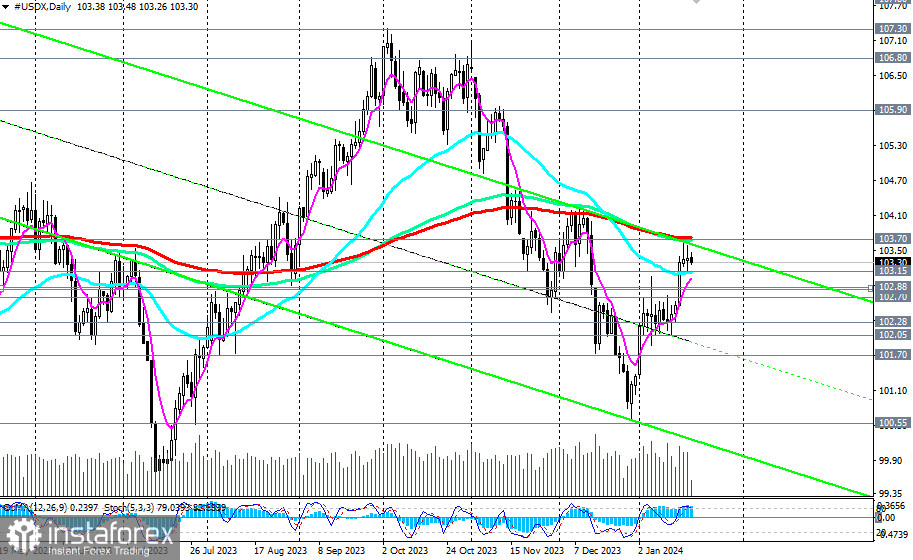
From a technical perspective, the U.S. Dollar Index (CFD #USDX on the MT4 terminal) is attempting to break into the medium-term bullish zone by testing the key medium-term resistance level of 103.70 (200 EMA, 144 EMA on the daily chart).

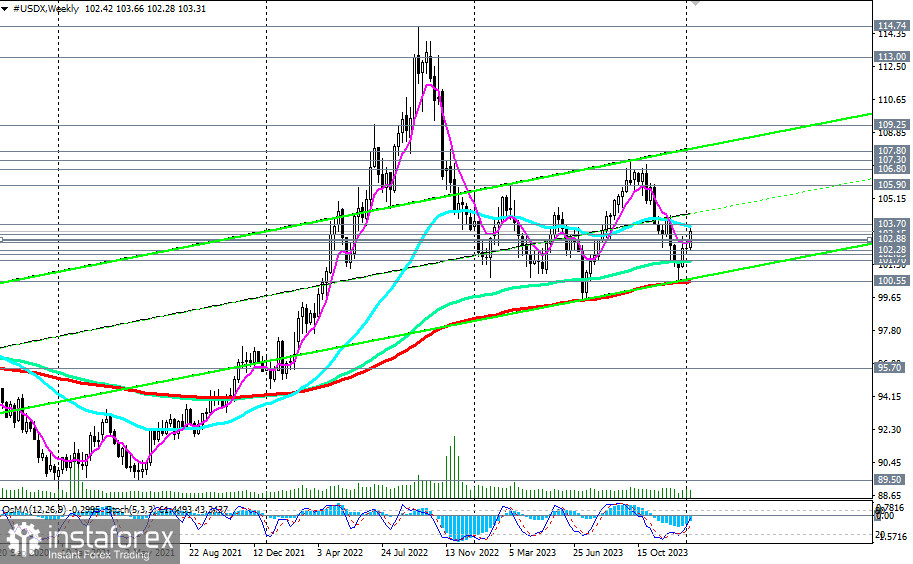
At the same time, the price remains in the long-term bullish market zone, above the key long-term support level of 100.55 (200 EMA on the weekly chart).
Therefore, a breakout of the key medium-term resistance level 103.70 will return the U.S. Dollar Index to the medium-term bullish market zone.
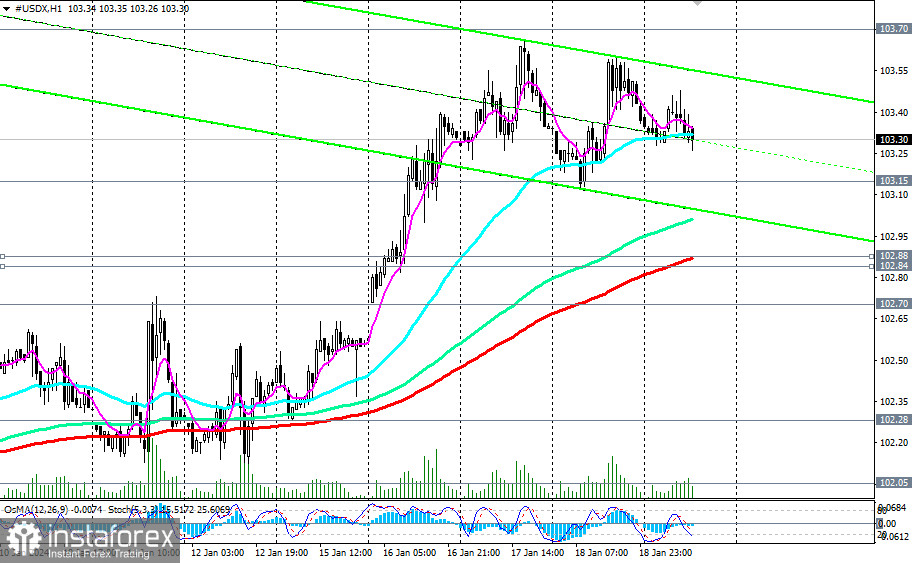
In an alternative scenario, a breakdown of the important support level of 103.15 (50 EMA on the daily chart) could be the first signal for a resumption of short positions, with a breakdown of the important short-term support levels of 102.88 (200 EMA on the 1-hour chart) and 102.84 (200 EMA on the 4-hour chart) confirming this.

Further decline and a breakdown of the key long-term support level of 100.55 (200 EMA on the weekly chart), followed by the level of 100.00, will place DXY into the long-term bearish market zone, making long-term short positions preferable from a technical standpoint.
Support levels: 103.15, 103.00, 102.88, 102.84, 102.70, 102.28, 102.05, 102.00, 101.70, 101.00, 100.55, 100.00
Resistance levels: 103.70, 104.00, 105.00, 105.90
Trading Scenarios:
Main Scenario: BuyStop at 103.80. Stop-Loss at 103.10. Targets at 104.00, 105.00, 106.00, 106.80, 107.00, 107.30, 107.80, 108.00, 109.00, 109.25
Alternative Scenario: SellStop at 103.10. Stop-Loss at 103.80. Targets at 103.00, 102.88, 102.84, 102.70, 102.28, 102.05, 102.00, 101.70, 101.00, 100.55, 100.00
"Targets" correspond to support/resistance levels. This does not necessarily mean that they will be reached, but they can serve as a reference for planning and placing your trading positions.


