Following the conclusion of today's meeting, the leaders of the Reserve Bank of New Zealand decided to keep the interest rate unchanged at 5.50%. In their accompanying statement, they mentioned the possibility of further interest rate hikes if necessary.
Immediately after the publication of this decision by the RBNZ, the New Zealand dollar sharply strengthened, and the NZD/USD pair surged during the Asian trading session to the level of 0.6207, the highest since August 2nd. However, at the end of December, the price reached the level of 0.6370, the highest since July 18th.

Overall, the corrective rise from November to December amounted to 10%, reaching the level of 0.6370 from the local low of 0.5773 reached at the end of October.
Nevertheless, in early January, the pair began to decline as the U.S. dollar attempted to recover after a deep two-month decline.
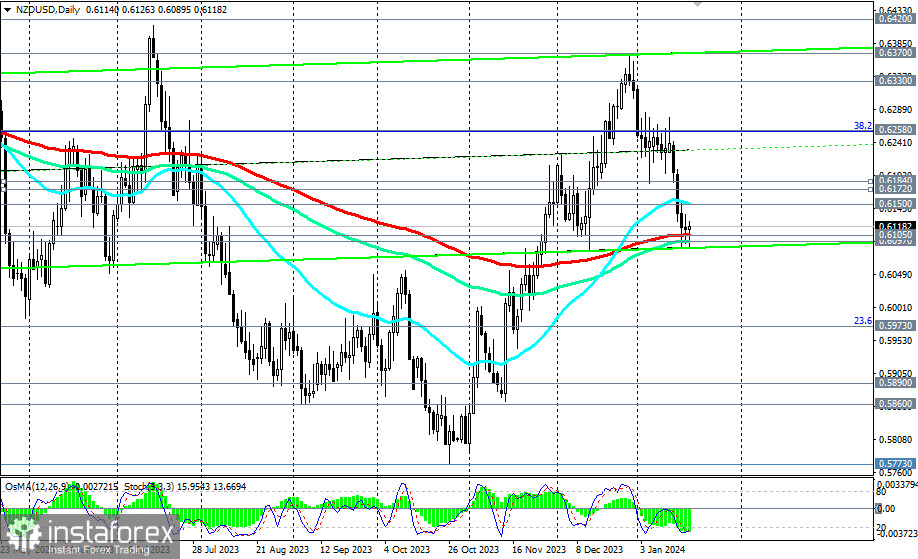
As of writing, NZD/USD was trading near the level of 0.6118, which is 13 points above the key medium-term support level of 0.6105 (200 EMA on the daily chart).
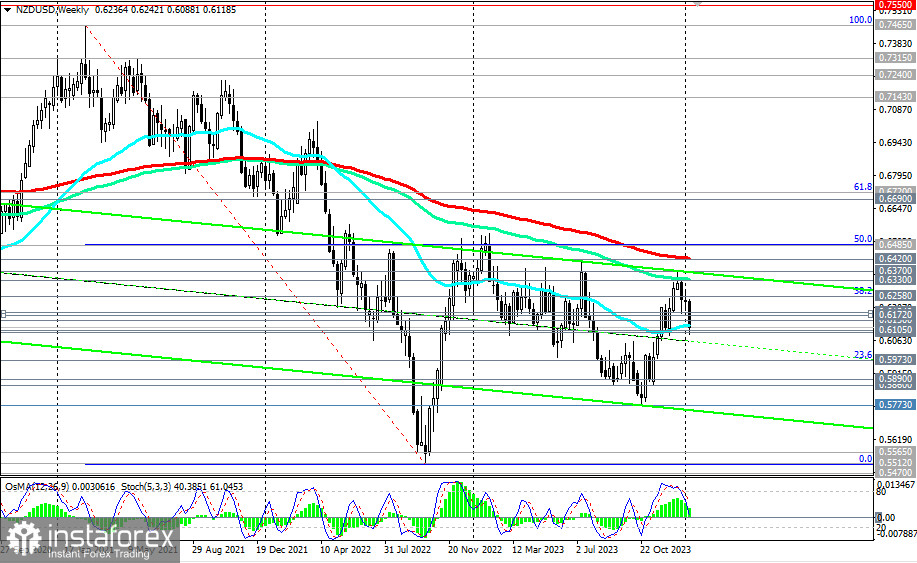
However, below the key resistance levels of 0.6400, 0.6420 (200 EMA on the weekly chart), 0.6485 (50% Fibonacci level of the pair's decline from 0.7465 in February 2021 to the level of 0.5510 reached in October 2022), NZD/USD remains in a long-term bearish market zone. To break into the long-term bullish zone, the price needs to overcome these resistance levels.
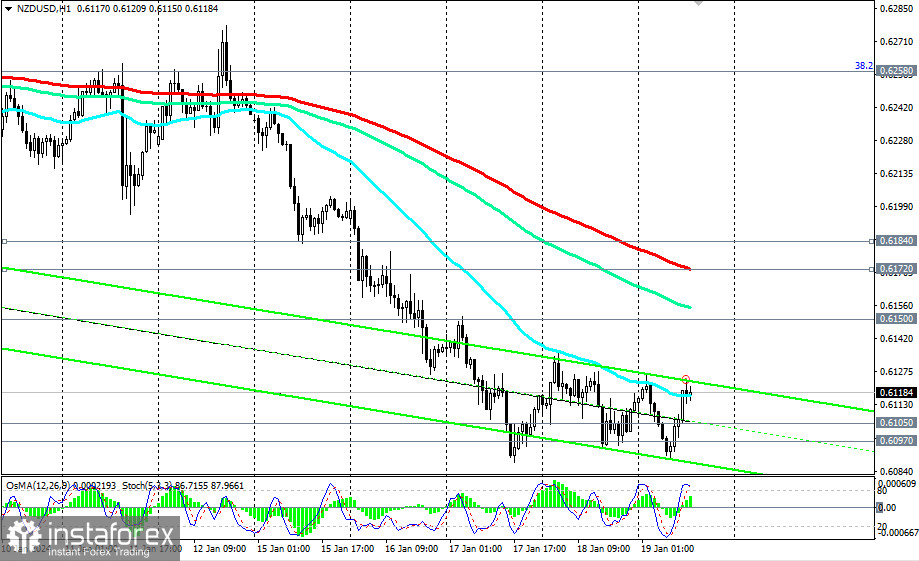
The earliest signal could be a breakout of yesterday's high at 0.6135, and a breakout of important short-term resistance levels at 0.6172 (200 EMA on the 1-hour chart) and 0.6184 (200 EMA on the 4-hour chart) would confirm this.

In the main scenario, we expect confirmation of a breakdown of the key medium-term support level of 0.6105, which would take NZD/USD into the zone of the medium-term bearish market and strengthen its downward dynamics within the long-term bearish market. The ultimate target, in this case, will be near the level of 0.5700, which is where the lower boundary of the downward channel on the weekly chart passes. Intermediate targets are at the support levels of 0.5973 (23.6% Fibonacci level), 0.5890, 0.5860, and 0.5780.
Support levels: 0.6105, 0.6097, 0.6000, 0.5973, 0.5900, 0.5890, 0.5860, 0.5780
Resistance levels: 0.6150, 0.6172, 0.6184, 0.6200, 0.6258, 0.6300, 0.6330, 0.6370, 0.6400, 0.6420, 0.6485, 0.6500
Trading Scenarios:
Main Scenario: Sell Stop at 0.6085. Stop-Loss at 0.6140. Targets at 0.6000, 0.5973, 0.5900, 0.5890, 0.5860, 0.5780
Alternative Scenario: Buy Stop at 0.6140. Stop-Loss at 0.6085. Targets at 0.6150, 0.6172, 0.6184, 0.6200, 0.6258, 0.6300, 0.6330, 0.6370, 0.6400, 0.6420, 0.6485, 0.6500
"Targets" correspond to support/resistance levels. This does not necessarily mean that they will be reached, but they can serve as a reference for planning and placing your trading positions.


