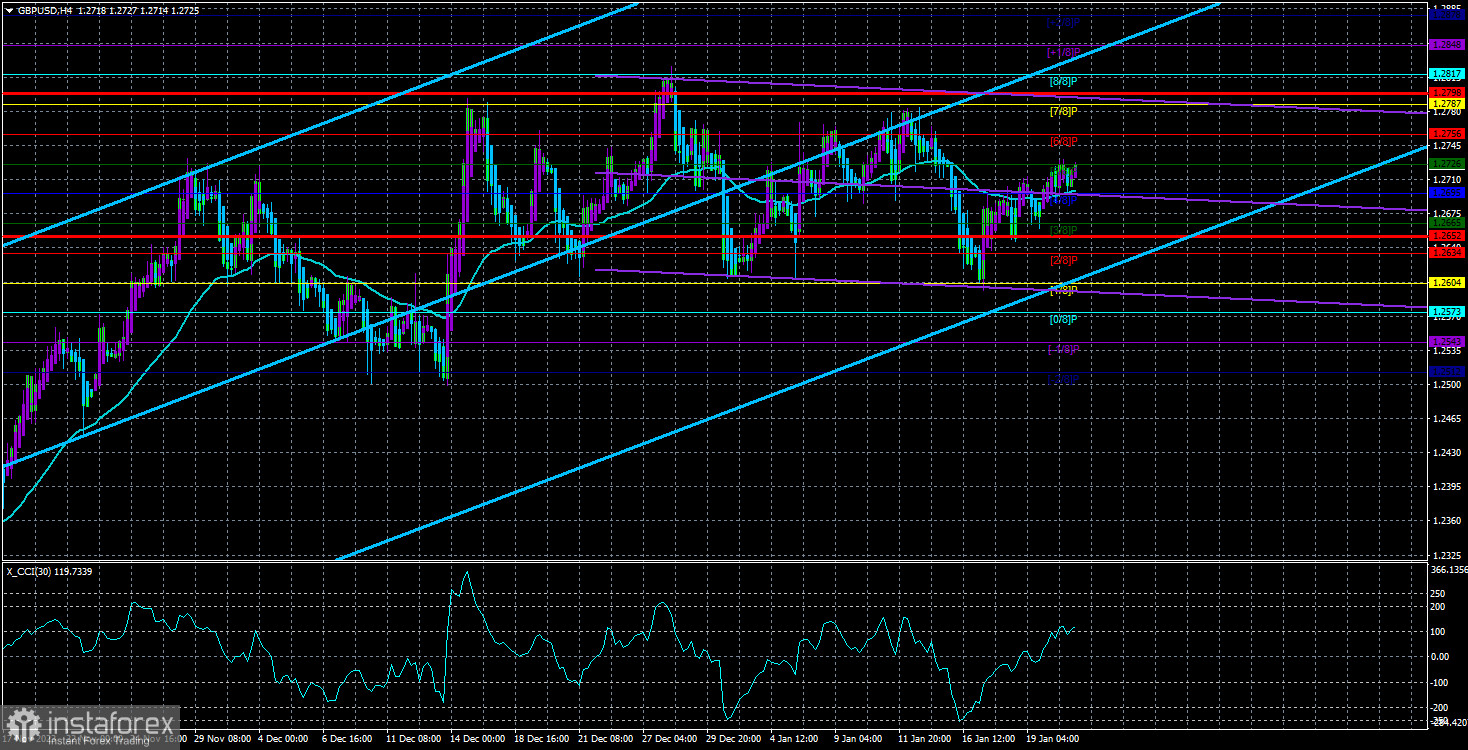
The GBP/USD currency pair also showed no interesting movements on Monday. We repeat practically the same thing about the current technical picture almost every day for one simple reason – it doesn't change. We want to discuss some interesting fundamental or macroeconomic events, but important macroeconomic reports are not published daily, and fundamental events occur less frequently.
In recent weeks, we have witnessed a plethora of speeches by representatives of the Fed and the ECB. However, all these speeches have only added more questions without answers rather than providing answers to existing questions. The market has yet to understand better what will happen with interest rates in 2024. On the contrary, the number of possible scenarios has increased.
The Bank of England should be the last to start lowering rates because inflation in the UK is the highest. However, we keep repeating the same thing – everything will depend on inflation, and as Bostjan Vasle said, inflation is volatile. Therefore, it is still very early to draw any conclusions, and making predictions about the timing of monetary policy easing is pointless.
However, the market is accustomed to buying rumors and selling on facts. It actively uses these rumors in its trading. These rumors are not confirmed because several Fed representatives have already stated that the market has overly high expectations from the Fed this year. The rate could be reduced by as much as eight times by 0.25% each if inflation suddenly drops to 2%. The rate may be reduced in increments of 0.5%, or it may be reduced if inflation slows down very slightly. No one can know the inflation pace even for the next few months.
One of the Fed's monetary committee members, Mary Daly, reiterated the obvious on Friday: the regulator still has a lot of work to do to bring inflation back to 2%, and it is too early to consider rate cuts. "It is premature to think that the first easing will happen very soon," Daly said. What else do official figures responsible for monetary policy need to say for the market to realize that a sharp rate cut is not on the cards?
"We need inflation to move towards 2% gradually; only then will we start to reconsider the monetary policy," Ms. Daly stated. However, the market has maintained high demand for the pound and low demand for the dollar over the past month and a half. And now it simply refuses to consider any other scenario, even though every day we receive more and more confirmations that the first Fed rate cut will not happen in March.
As for the most important aspect, the pound sterling remains within the sideways range of 1.2611–1.2787. We believe fundamental and macroeconomic events are irrelevant, as the pair has been flat for over a month. It is moving towards the upper boundary of the sideways channel, as it recently bounced off the lower one. The "head and shoulders" pattern can be forgotten because the flat has broken it. Therefore, all that remains is the failure to surpass the important level of 1.2763 (61.8% Fibonacci) on the 24-hour TF. If this level is breached, the pound will continue its illogical rise.

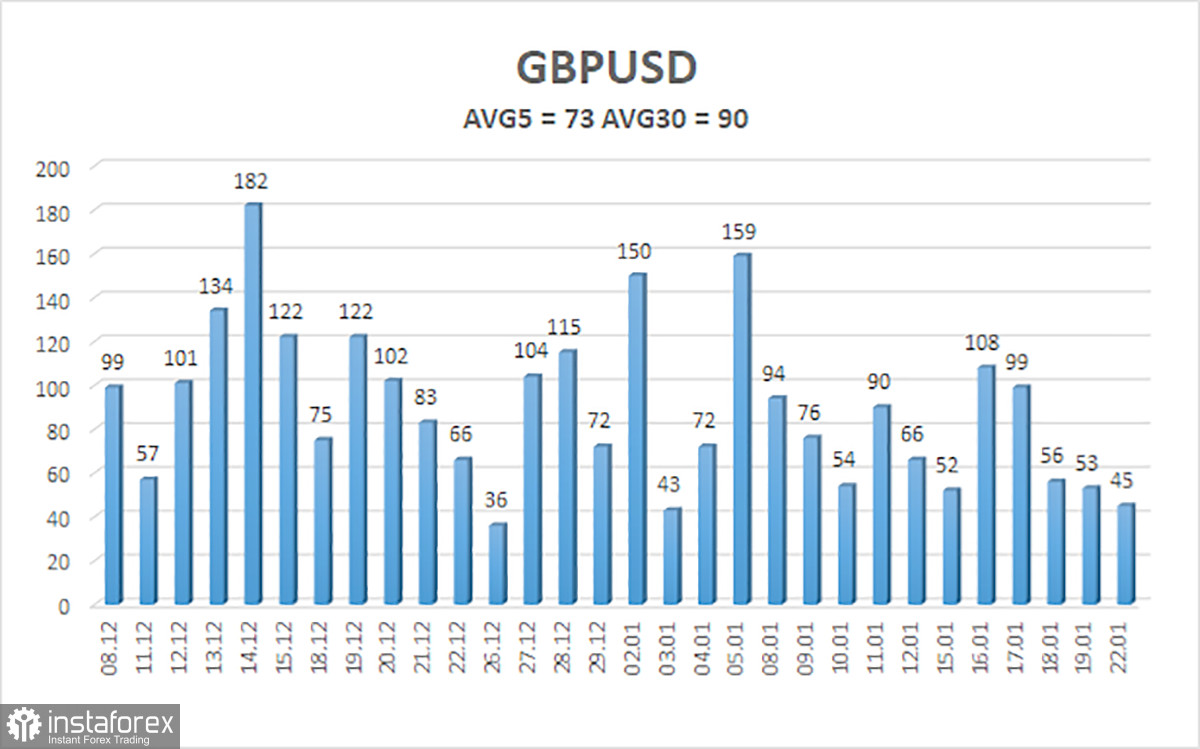
The average volatility of the GBP/USD pair over the last five trading days is 73 points. For the pound/dollar pair, this value is considered "average." On Tuesday, January 23rd, we expect movement within the range limited by the levels 1.2652 and 1.2798. A downward reversal of the Heiken Ashi indicator will indicate a new attempt to start a downward trend.
Nearest support levels:
S1 - 1.2695
S2 - 1.2665
S3 - 1.2634
Nearest resistance levels:
R1 - 1.2726
R2 - 1.2756
R3 - 1.2787
Explanations for the illustrations:
Linear regression channels - help determine the current trend. If both point in the same direction, the trend is strong right now.
The moving average line (settings 20.0, smoothed) - determines the short-term trend and the direction to trade in.
Murray levels - target levels for movements and corrections.
Volatility levels (red lines) - the probable price channel in which the pair will trade in the next 24 hours, based on current volatility indicators.
CCI indicator - entering the overbought territory (above +250) or oversold territory (below -250) indicates an upcoming trend reversal in the opposite direction.


