Analysis of GBP/USD 5M

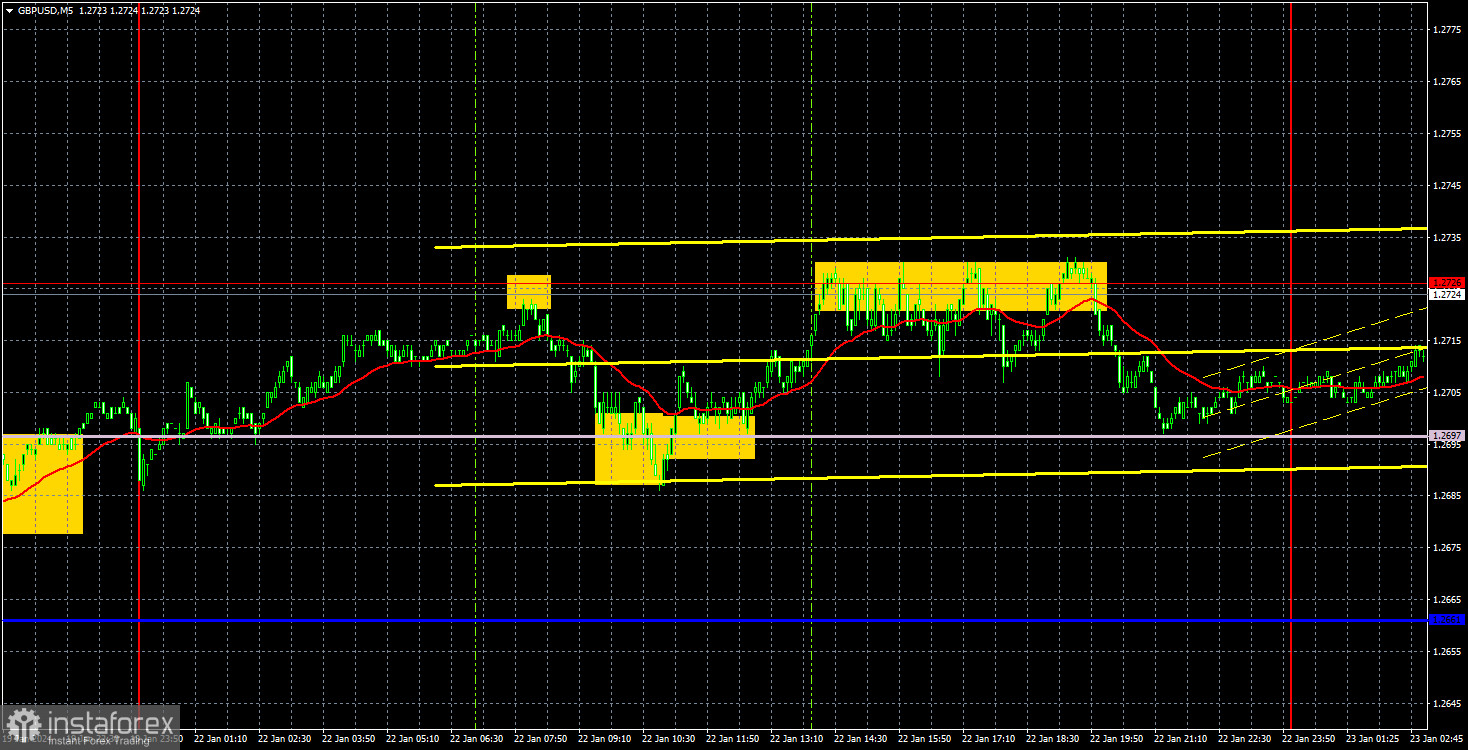
GBP/USD steadily moved towards the level of 1.2786 on Monday. However, it's a stretch to call it a movement. Volatility was no more than 50 pips, which is quite low for any currency pair, and especially for the pound. At the end of the day, the price couldn't surpass the intermediate level of 1.2726, which traders had worked on last Friday.
Therefore, the pair is still staying within the sideways range of 1.2620-1.2786, above the Ichimoku indicator lines. Accordingly, it may continue to rise for several more days. This isn't really quite important in the absence of a fundamental and macroeconomic background on Monday, since the pair has been in a flat phase for more than a month. Movements within the flat are quite understandable, but it is still difficult to trade the pair due to low volatility.
We still believe that the pound is significantly overbought and is trading at an unjustifiably high level. However, the market believes that the Bank of England will start lowering the key rate much later than the Federal Reserve, and this provides support to the British currency. In our opinion, this factor has already been worked out, but the market currently holds a different perspective.
Several trading signals were generated on the 5-minute chart. The price repeatedly bounced off the level of 1.2726, as well as from the Senkou Span B line. These were not the worst signals, but given the strength of the movements we saw yesterday, it was extremely difficult to expect high profits even from strong signals. As a result, each of the three trades could yield no more than 15 pips.
COT report:

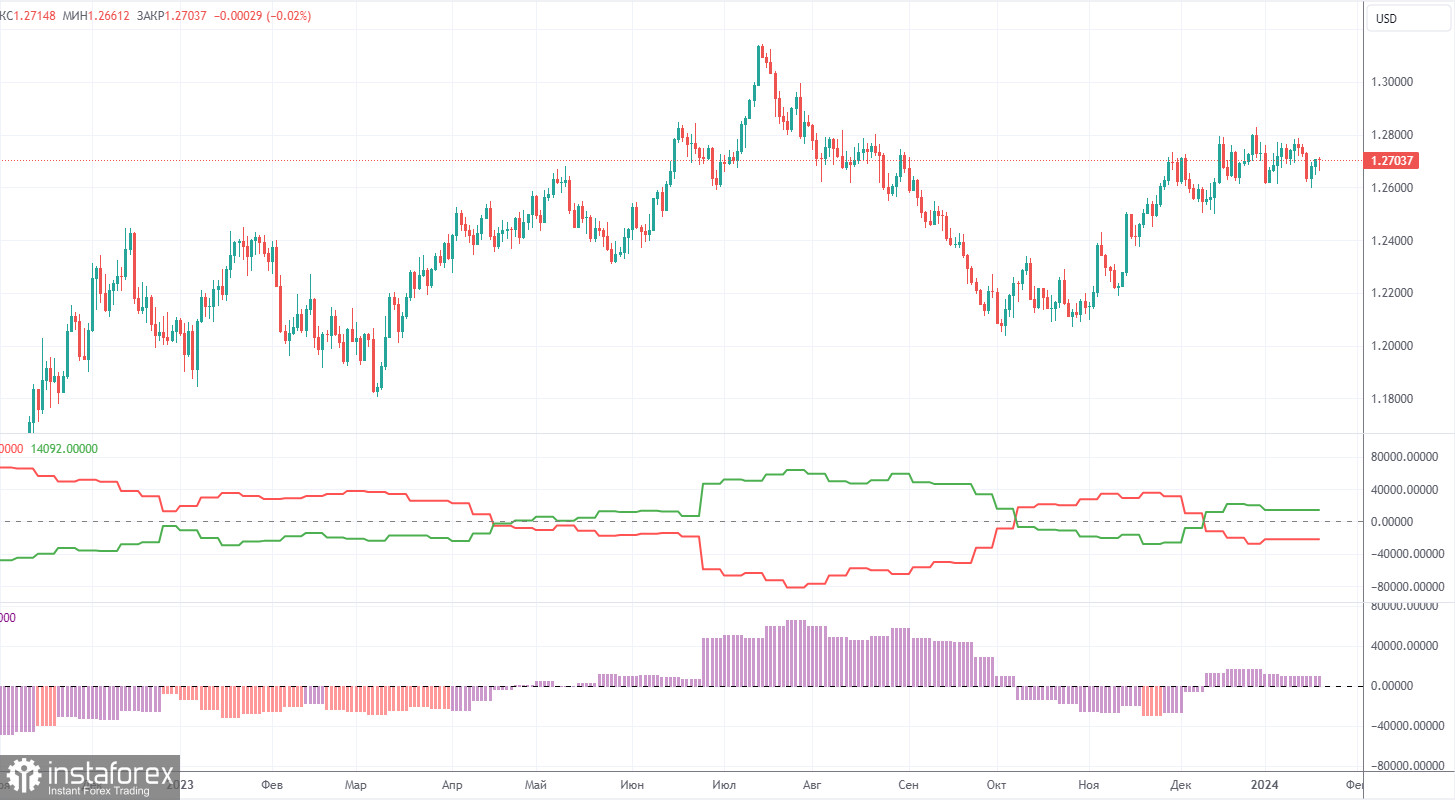
COT reports on the British pound show that the sentiment of commercial traders has been changing quite frequently in recent months. The red and green lines, representing the net positions of commercial and non-commercial traders, often intersect and, in most cases, are close to the zero mark. According to the latest report on the British pound, the non-commercial group opened 5,500 buy contracts and closed 4,600 short ones. As a result, the net position of non-commercial traders increased by 10,100 contracts in a week. Since big buyers currently don't have the advantage, we believe that the pound will not be able to sustain the upward movement for a long time. The fundamental backdrop still does not provide a basis for long-term purchases on the pound.
The non-commercial group currently has a total of 66,200 buy contracts and 35,300 sell contracts. Since the COT reports do not provide an accurate forecast of the market's behavior at the moment, we need to pay closer attention to the technical picture and economic reports. However, even these types of analysis are currently secondary because, despite everything, the market maintains a bullish bias towards the pound, and the price has been in a flat range for a month. The technical analysis suggests that there's a possibility that the pound could show a pronounce downward movement (but there are no clear sell signals yet), and for a long time now, the economic reports have also been significantly stronger in the United States than in the United Kingdom, but this has not benefited the dollar.
Analysis of GBP/USD 1H

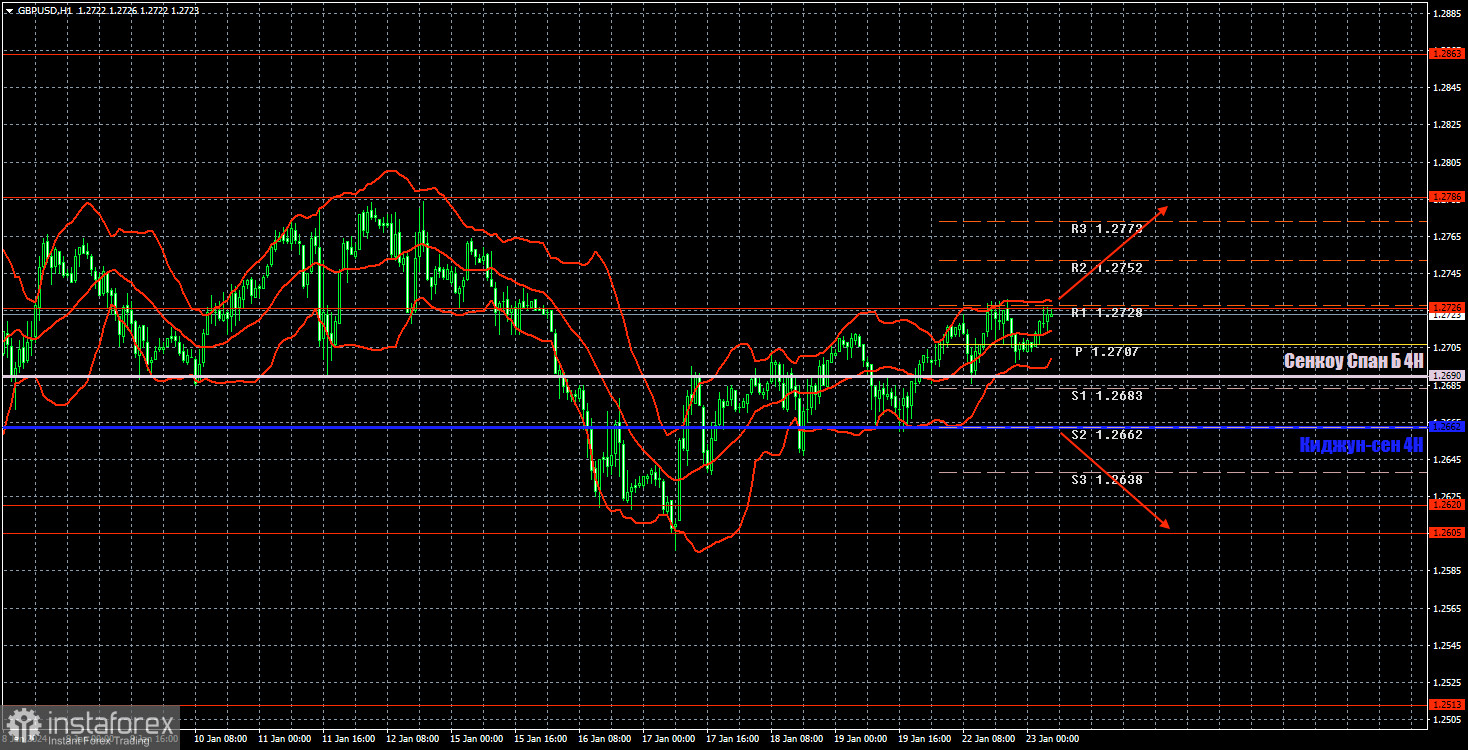
On the 1H chart, GBP/USD continues to move higher after bouncing from the 1.2605-1.2620 area. The wide sideways channel is still relevant, and the price has been unable to break out of it for a month now. Therefore, it wouldn't be surprising if the pound continues to rise within the flat today.
On Tuesday, the pair has a higher chance of rising than falling. The price is in the middle of the sideways channel but above the Senkou Span B and Kijun-sen lines. Therefore, we believe that you may consider long positions with 1.2786 as the target, but take note that we are dealing with a flat market, and movements could turn out to be random.
As of January 23, we highlight the following important levels: 1.2215, 1.2269, 1.2349, 1.2429-1.2445, 1.2513, 1.2605-1.2620, 1.2726, 1.2786, 1.2863, 1.2981-1.2987. The Senkou Span B (1.2690) and Kijun-sen (1.2662) lines can also serve as sources of signals. Don't forget to set a breakeven Stop Loss to breakeven if the price has moved in the intended direction by 20 pips. The Ichimoku indicator lines may move during the day, so this should be taken into account when determining trading signals.
Today, there are no significant events lined up in the UK and the US. Therefore, it would be pointless to expect strong movements. At best, the pound may gradually rise.
Description of the chart:
Support and resistance levels are thick red lines near which the trend may end. They do not provide trading signals;
The Kijun-sen and Senkou Span B lines are the lines of the Ichimoku indicator, plotted to the 1H timeframe from the 4H one. They provide trading signals;
Extreme levels are thin red lines from which the price bounced earlier. They provide trading signals;
Yellow lines are trend lines, trend channels, and any other technical patterns;
Indicator 1 on the COT charts is the net position size for each category of traders;
Indicator 2 on the COT charts is the net position size for the Non-commercial group.


