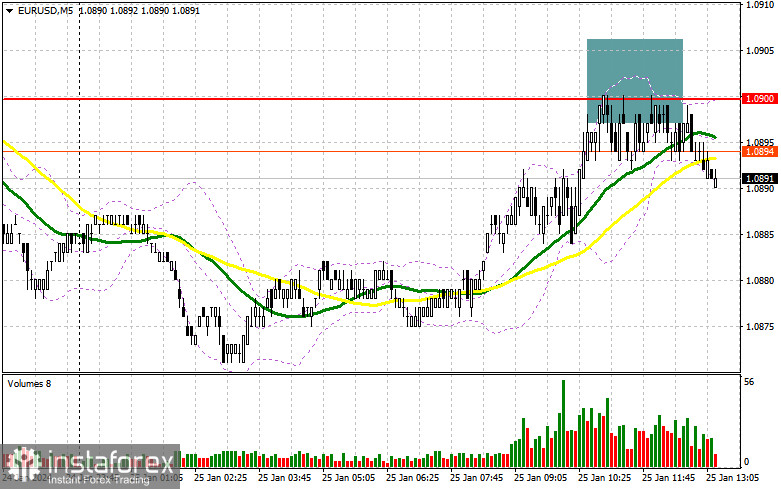
In my morning forecast, I drew attention to the level of 1.0900 and planned to make trading decisions based on it. Let's look at the 5-minute chart and analyze what happened there. The rise and false breakout at this level signaled to sell, but as you can see on the chart, a significant downward movement did not materialize. In the second half of the day, the technical picture remained unchanged.

To open long positions on EUR/USD, the following conditions are required:
Ahead of us is the ECB's decision on interest rates, but more importantly, we are interested in the tone set by President Christine Lagarde. Her dovish stance could lead the euro towards weekly lows and their renewal. If the decision is made to maintain the current policy for greater clarity, the euro could temporarily rise. We also have data on the change in US GDP for the fourth quarter, the number of initial jobless claims, and new home sales figures. If GDP turns out to be better than economists' forecasts, it could be a reason to buy the dollar and sell the euro amid all this uncertainty about the ECB's future policy.
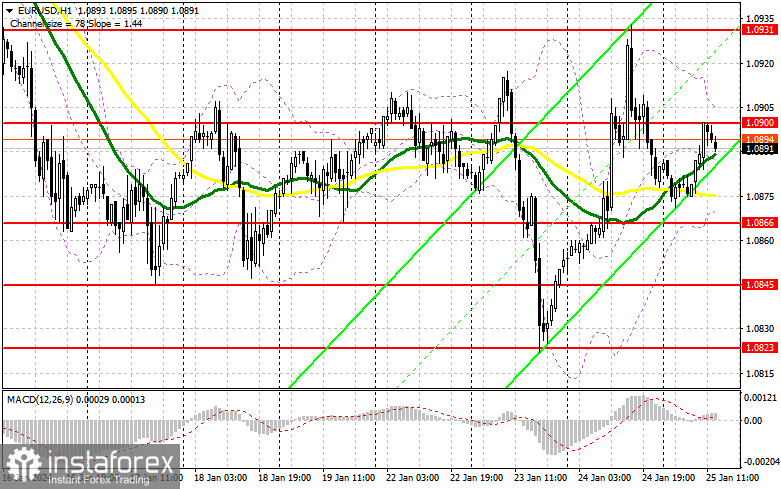
Regarding the technical picture, it remains unchanged. I will act according to the following scenario: if the pair declines to the nearest support at 1.0866, which was formed based on yesterday's results, and forms a false breakout there, paired with weak GDP data, it would be a suitable entry point for me for an upward correction towards 1.0900, which has not been surpassed so far. Only a breakthrough and confirmation above this range will provide an opportunity for buying with the prospect of a more significant upward correction and a target of 1.0931. The ultimate target will be at 1.0966, where I will take a profit. Testing this level will indicate the formation of a new upward trend. In the case of a decline in EUR/USD and the absence of activity at 1.0866 in the second half of the day, selling pressure will return. In this case, I plan to enter the market only after forming a false breakout around 1.0845. I will consider opening long positions on a bounce from 1.0823 with a target of an upward correction of 30-35 points within the day.
To open short positions on EUR/USD, the following conditions are required:
The bears still have a chance for a more substantial sell-off, and the ECB's dovish stance could contribute to it. In case of a minor rise in the pair, sellers must defend the nearest resistance at 1.0900, similar to what I discussed above. A false breakout at that level will indicate the presence of major players in the market, leading to a downward movement towards 1.0866, an intermediate support level where moving averages are located, favoring buyers. Reaching this level is a significant task. Only after breaking below and confirming this range and a retest from below to above do I expect another selling opportunity with a target of 1.0845, which would be challenging to breach. The ultimate target will be the minimum at 1.0823, where I will take profit. In the case of an upward movement of EUR/USD in the second half of the day and the absence of bears at 1.0900, demand for EUR/USD will return, leading to a bullish market. In such a case, I will postpone selling until testing the next resistance at 1.0931. I will sell there as well, but only after an unsuccessful consolidation. I plan to open short positions on a rebound from 1.0966 with a target of a downward correction of 30-35 points.


Indicator Signals:
Moving Averages
Trading is conducted around the 30 and 50-day moving averages, indicating a sideways market.
Note: The author analyzes the moving averages' period and prices on the hourly chart (H1) and differs from the general definition of classical daily moving averages on the daily chart (D1).
Bollinger Bands
In case of a decline, the lower boundary of the indicator at around 1.0866 will act as support.
Description of Indicators:
- Moving Average (a tool that determines the current trend by smoothing out volatility and noise). Period 50. Marked in yellow on the chart.
- Moving Average (a tool that determines the current trend by smoothing out volatility and noise). Period 30. Marked in green on the chart.
- MACD Indicator (Moving Average Convergence/Divergence) Fast EMA period 12. Slow EMA period 26. SMA period 9.
- Bollinger Bands. Period 20.
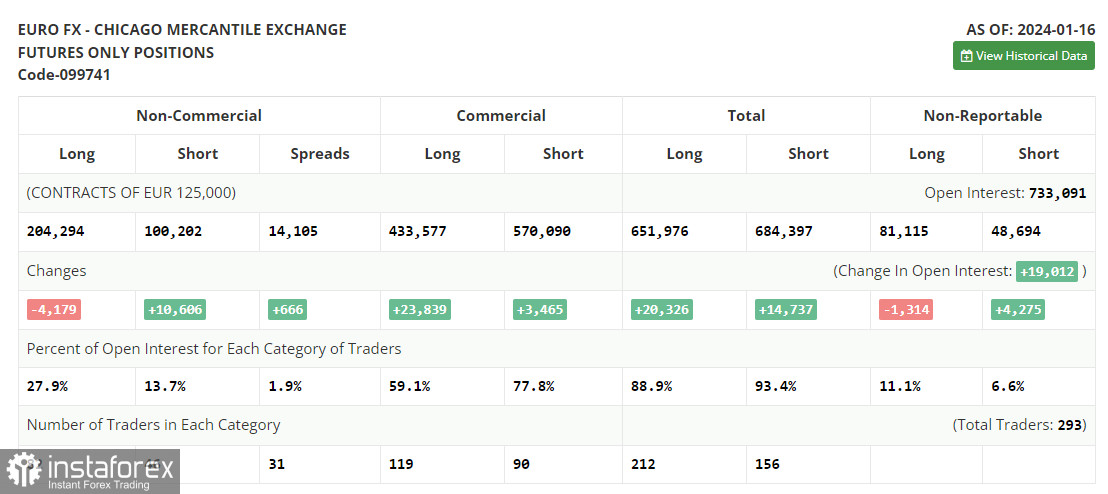
- Non-commercial traders, such as individual traders, hedge funds, and large institutions, use the futures market for speculative purposes and meet certain requirements.
- Long non-commercial positions represent the total long open positions of non-commercial traders.
- Short non-commercial positions represent the total short open positions of non-commercial traders.
- The total non-commercial net position is the difference between short and long non-commercial positions.


