


Analyzing Friday's trades:
GBP/USD on 1H chart
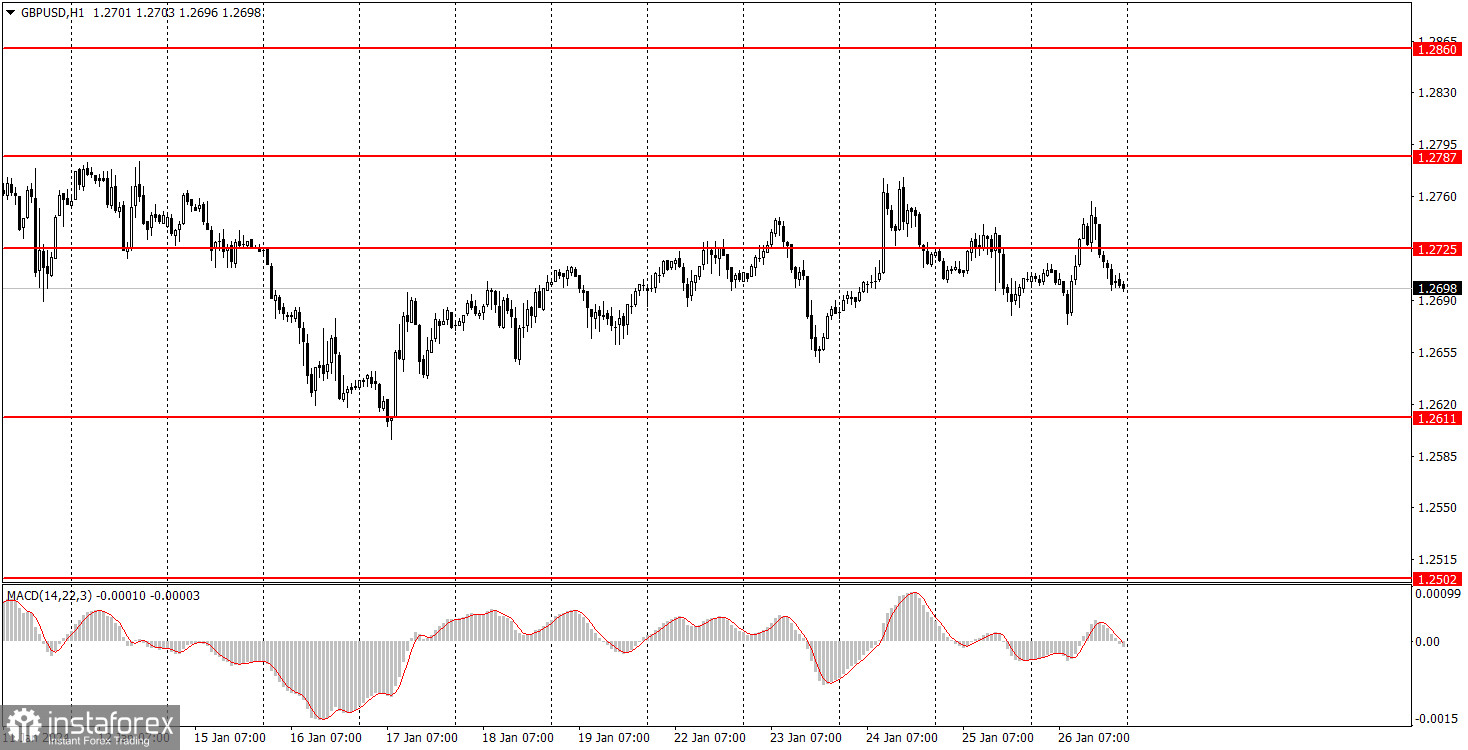
GBP/USD traded in different directions on Friday, which is similar to what we have been seeing for quite some time. As a reminder, for the past one and a half months, the British pound has been moving between the levels of 1.2611 and 1.2787, forming a sideways channel with all the consequences. Such illogical and strange movements within the sideways channel represent the essence of a flat. Also, it is worth noting that after bouncing off the lower boundary of the channel at the level of 1.2611, the price failed to reach the upper boundary at the level of 1.2787. This may happen in the near future, but from where it stands, the pair could easily reverse back towards 1.2611.
On Friday, there were no interesting events in the UK, and the market was only mildly interested in the US reports. The British currency gladly rose during the European trading session even in the absence of interesting events, but it showed significantly weaker movements during the US session, despite the release of three US reports. As we can see, the macroeconomic background did not affect the pair's movement.
GBP/USD on 5M chart
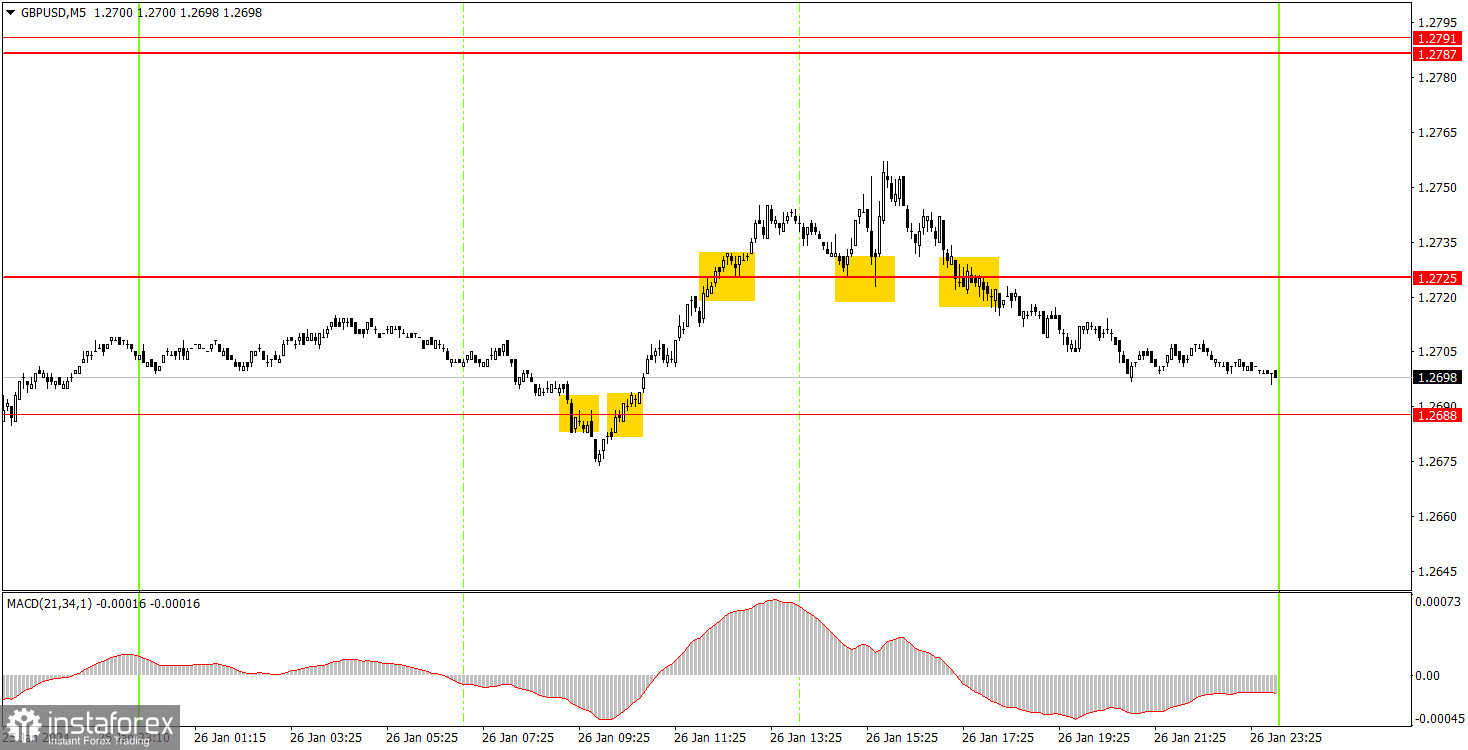
The movements on the 5-minute timeframe were not the best, and neither were the trading signals. Nevertheless, you could have gained some profit from them. The first sell signal around the level of 1.2688 turned out to be a false signal, and the price even failed to move in the intended direction by 20 pips, which was enough to set a stop loss to breakeven. The next buy signal around the same level of 1.2688 can already be considered a strong signal. The price grew by about 60 pips and surpassed the level of 1.2725 along the way. It was necessary to close the long positions when the pair dropped below this level (sell signal). The profit was about 15-20 pips, covering the loss from the first trade. It made no sense to execute the last sell signal as it was formed quite late.
Trading tips on Monday:
On the hourly chart, GBP/USD is still trading within the sideways channel of 1.2611-1.2787. The price bounced off the level of 1.2611 five times, and after the last bounce, a new uptrend has started within the flat. The pair has not yet reached the upper boundary of the channel, and now it is in the middle of the sideways channel. Therefore, the pair could move in any direction on Monday.
The British pound will likely remain within the sideways channel. We have not seen any good signals regarding the pair's near-term trend at the moment.
The key levels on the 5M chart are 1.2270, 1.2310, 1.2372-1.2387, 1.2457, 1.2502, 1.2544, 1.2605-1.2611, 1.2688, 1.2725, 1.2787-1.2791, 1.2848-1.2860, 1.2913, 1.2981-1.2993. On Monday, there are no significant events lined up in the UK and the US. Therefore, the pair will likely stay within the sideways channel, but take note that a flat often ends abruptly and unexpectedly when nothing indicates it.
Basic trading rules:
1) Signal strength is determined by the time taken for its formation (either a bounce or level breach). A shorter formation time indicates a stronger signal.
2) If two or more trades around a certain level are initiated based on false signals, subsequent signals from that level should be disregarded.
3) In a flat market, any currency pair can produce multiple false signals or none at all. In any case, the flat trend is not the best condition for trading.
4) Trading activities are confined between the onset of the European session and mid-way through the U.S. session, after which all open trades should be manually closed.
5) On the 30-minute timeframe, trades based on MACD signals are only advisable amidst substantial volatility and an established trend, confirmed either by a trendline or trend channel.
6) If two levels lie closely together (ranging from 5 to 15 pips apart), they should be considered as a support or resistance zone.
How to read charts:
Support and Resistance price levels can serve as targets when buying or selling. You can place Take Profit levels near them.
Red lines represent channels or trend lines, depicting the current market trend and indicating the preferable trading direction.
The MACD(14,22,3) indicator, encompassing both the histogram and signal line, acts as an auxiliary tool and can also be used as a signal source.
Significant speeches and reports (always noted in the news calendar) can profoundly influence the price dynamics. Hence, trading during their release calls for heightened caution. It may be reasonable to exit the market to prevent abrupt price reversals against the prevailing trend.
Beginners should always remember that not every trade will yield profit. Establishing a clear strategy coupled with sound money management is the cornerstone of sustained trading success.


