


Analysis of macroeconomic reports:
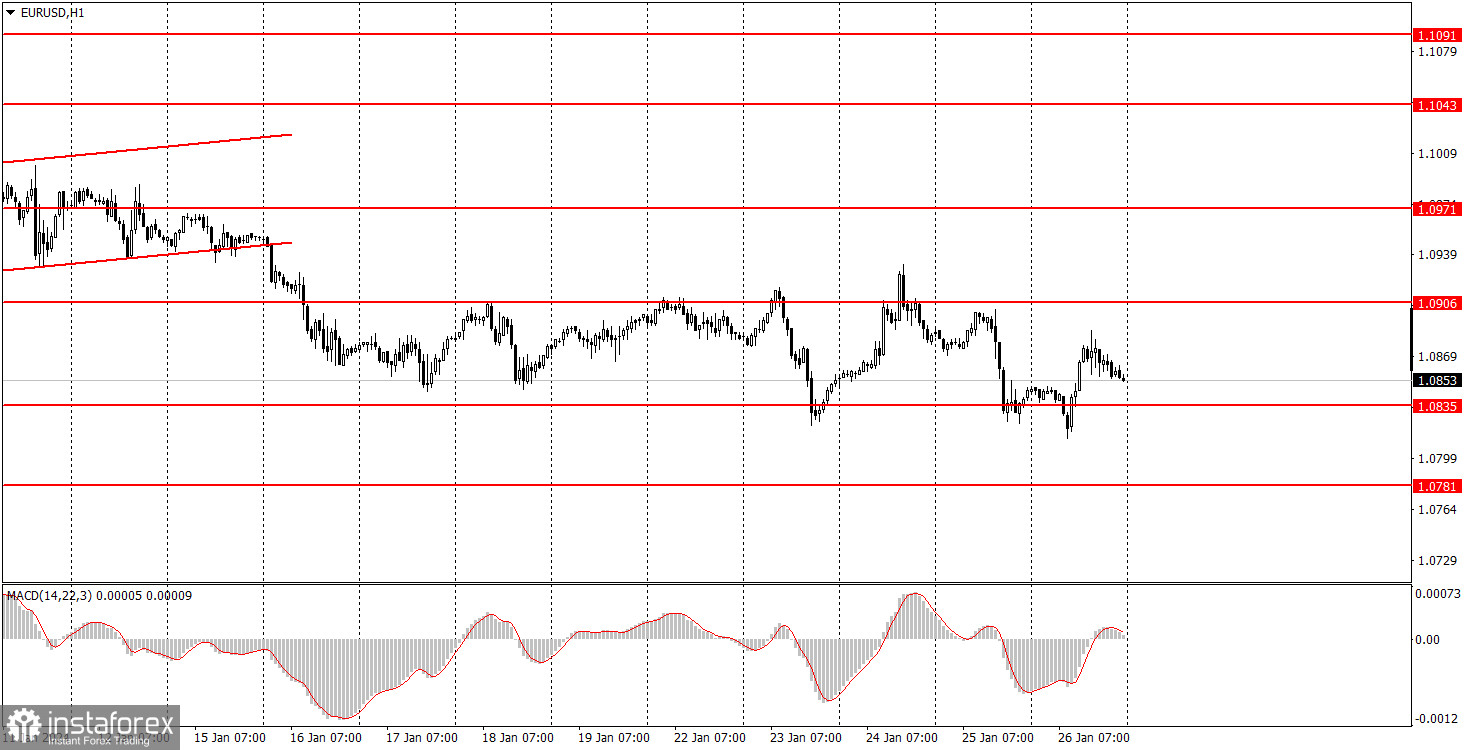
The economic calendar is entirely empty on Monday. We are anticipating another "quiet Monday". It seems unlikely for the euro or the pound to break out of the flat. More precisely, the euro has a small chance of resuming the downward movement (which is unlikely to be strong) since the price has already breached the level of 1.0835 twice. On the other hand, the pound, which is right in the middle of its sideways channel, has virtually no chance of breaking out of it.
Analysis of fundamental events:
Among the fundamental events of Monday, we can only highlight the speech of European Central Bank Vice President Luis de Guindos. It is unlikely for his speech to be resonant since the ECB meeting already happened on Thursday, and ECB President Christine Lagarde already provided the market with all the relevant information on monetary policy. Nevertheless, it's worth paying attention to this event as it may help clarify the central bank's plans for the first half of 2024.

General conclusion:
On Monday, we expect weak movements for both currency pairs. Most likely, the flat will persist. Even significant movements during the day are unlikely to take the British pound out of the flat phase, as the sideways channel is wide enough. In the euro's case, there is a slightly better chance of ending the flat, but for this to happen, the price needs to settle below the level of 1.0835.
Basic rules of a trading system:
1) Signal strength is determined by the time taken for its formation (either a bounce or level breach). A shorter formation time indicates a stronger signal.
2) If two or more trades around a certain level are initiated based on false signals, subsequent signals from that level should be disregarded.
3) In a flat market, any currency pair can produce multiple false signals or none at all. In any case, the flat trend is not the best condition for trading.
4) Trading activities are confined between the onset of the European session and mid-way through the U.S. session, after which all open trades should be manually closed.
5) On the 30-minute timeframe, trades based on MACD signals are only advisable amidst substantial volatility and an established trend, confirmed either by a trendline or trend channel.
6) If two levels lie closely together (ranging from 5 to 15 pips apart), they should be considered as a support or resistance zone.
How to read charts:
Support and Resistance price levels can serve as targets when buying or selling. You can place Take Profit levels near them.
Red lines represent channels or trend lines, depicting the current market trend and indicating the preferable trading direction.
The MACD(14,22,3) indicator, encompassing both the histogram and signal line, acts as an auxiliary tool and can also be used as a signal source.
Significant speeches and reports (always noted in the news calendar) can profoundly influence the price dynamics. Hence, trading during their release calls for heightened caution. It may be reasonable to exit the market to prevent abrupt price reversals against the prevailing trend.
Beginners should always remember that not every trade will yield profit. Establishing a clear strategy coupled with sound money management is the cornerstone of sustained trading success.


