Analysis of EUR/USD 1H

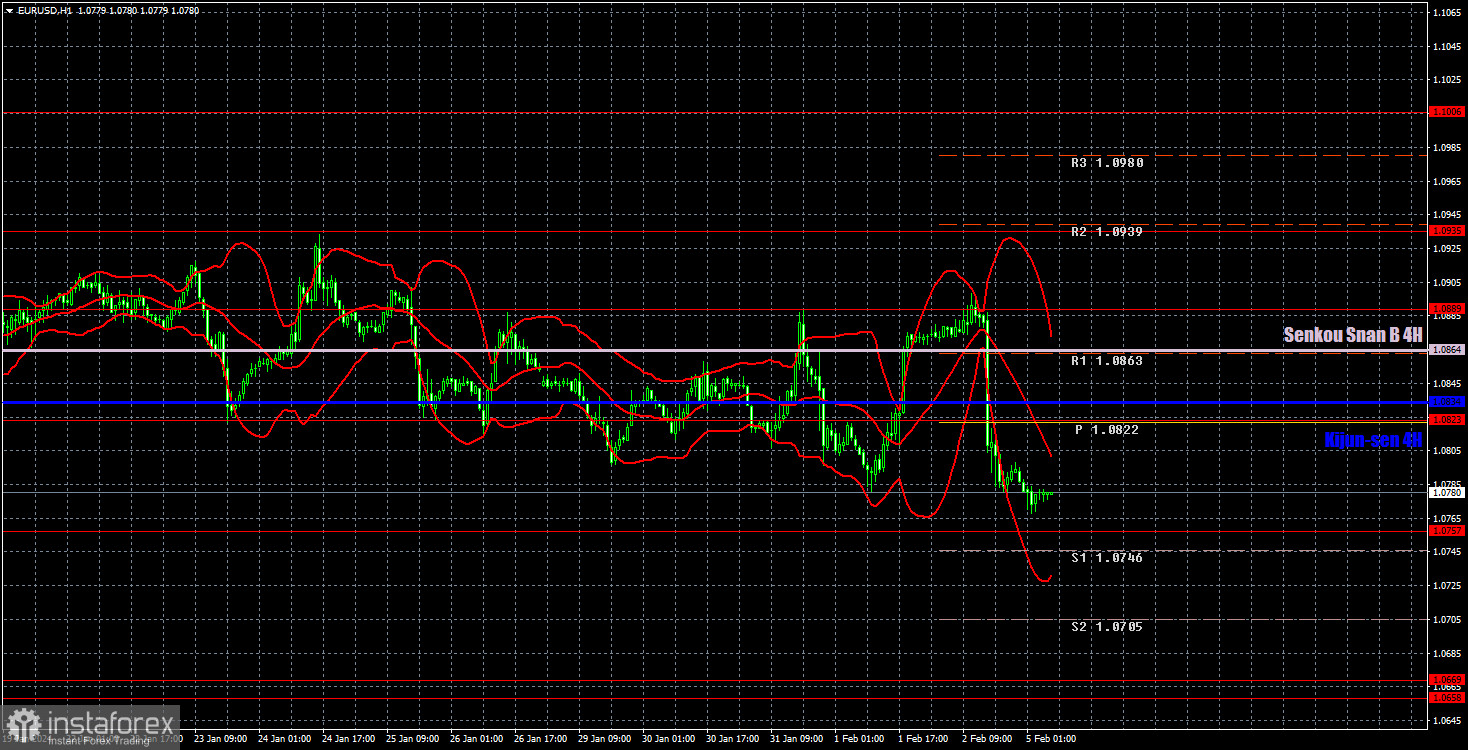
EUR/USD showed negative trades on Friday, driven solely by US labor market data. As a result, the downward trend resumed, and the bears were invigorated. The price dropped to its previous local low and the level of 1.0757. On Friday, it failed to overcome the level of 1.0889 for the second time.
We believe that these technical signals indicate that there's a high probability that the US dollar will continue to rise. However, if we look at the entire downward movement starting from December 28, we can see that it is not exactly strong. The pair often corrects and bounces back to the upside, so we advise you not to expect the euro to fall on a daily basis.
On Friday and throughout the past week, we received a huge amount of important reports, which generally confirmed that the US economy is in good shape, unlike the European and British economies. If the monetary policy of the Federal Reserve differed significantly from the policies of the Bank of England or the European Central Bank, we could expect a somewhat different type of movement. However, both the BoE and the ECB also plan to start monetary easing in the summer. Market expectations of the first Federal Reserve rate cut in March are unlikely to materialize.
It turns out that the Fed will start to trim rates at a later period than the market anticipated, while the ECB and the BoE will do so earlier than the market expected. The Fed's rate is unlikely to fall faster than in the European Union or the United Kingdom, as no central bank can claim victory over inflation at the moment.
Today, we believe that you may consider a rebound from the level of 1.0757 as a buy signal. Given how often the euro corrects to the upside, a bullish rebound with the Kijun-sen line as the target would be quite natural.
Analysis of GBP/USD 1H

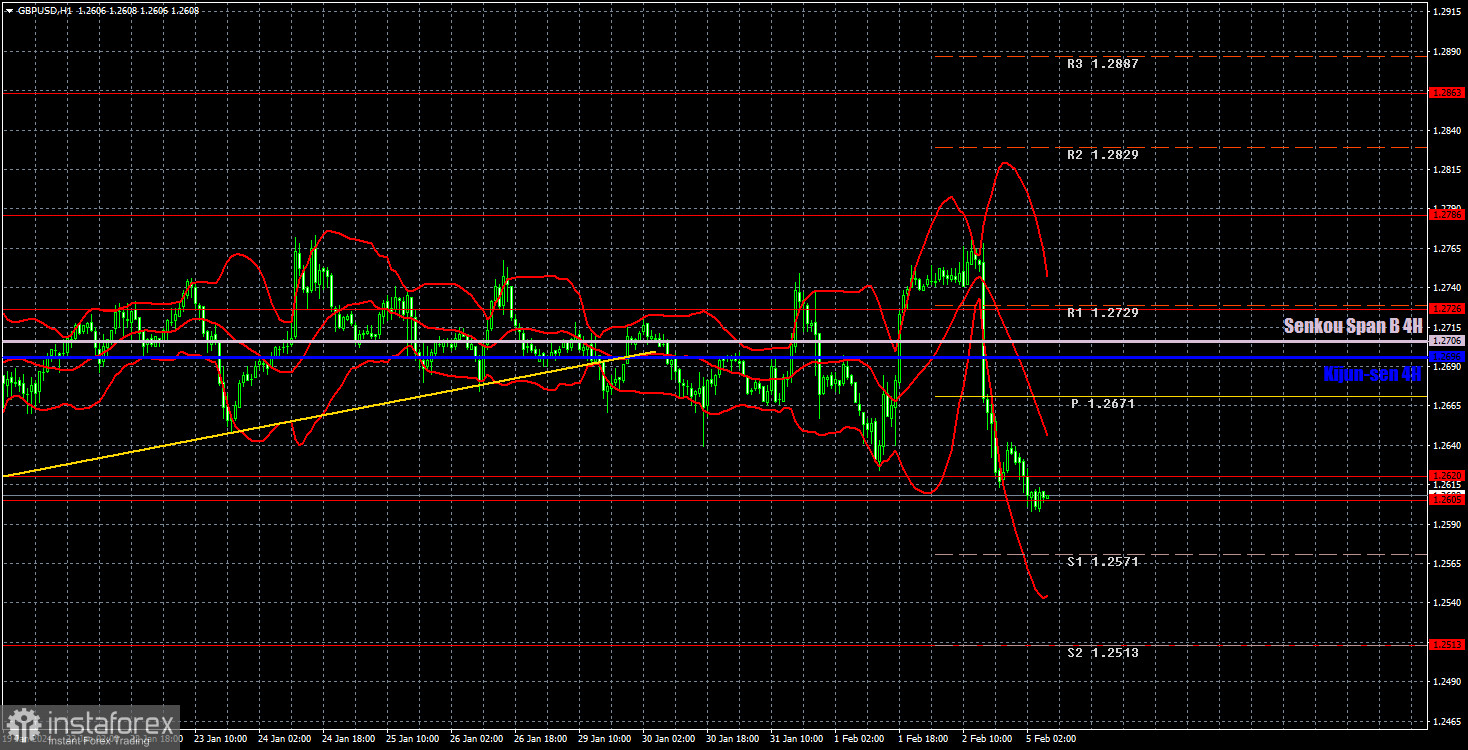
On the hourly timeframe, the GBP/USD pair fell into the 1.2605-1.2620 range, which, as a reminder, is the lower boundary of the sideways channel at 1.2611-1.2787, where the price has been for a month. The fact that the price is near the lower boundary opens up excellent trading opportunities for traders on Monday and Tuesday. The point is that over the past month, the price has never stayed near the boundaries for a long time. Therefore, today we can expect a clear rebound or a clear breakthrough.
Obviously, in the first case, it would be reasonable to buy with the Kijun-sen line (1.2696) as the target, and in the second case, you may consider selling with the level of 1.2513 as the target. We believe that the market's reluctance to sell the pound may save the British currency from an inevitable decline. Over the past months (when the pound either rose or stayed flat), there have been plenty of reasons for the quote to leave the sideways channel and resume the downtrend. However, the level of 1.2611 has always been in the way, around which large pending long positions are obviously located.
Thus, regardless of the fundamental and macroeconomic background, if the pair doesn't settle below 1.2611, it will be very difficult to overcome this level. But at the same time, there is no reason to buy the pound above the sideways channel either. Therefore, we still expect a sharp decline in the British currency.
Description of the chart:
Support and resistance levels are thick red lines near which the trend may end. They do not provide trading signals;
The Kijun-sen and Senkou Span B lines are the lines of the Ichimoku indicator, plotted to the 1H timeframe from the 4H one. They provide trading signals;
Extreme levels are thin red lines from which the price bounced earlier. They provide trading signals;
Yellow lines are trend lines, trend channels, and any other technical patterns;
Indicator 1 on the COT charts is the net position size for each category of traders;
Indicator 2 on the COT charts is the net position size for the Non-commercial group.


