Analysis of GBP/USD 5M

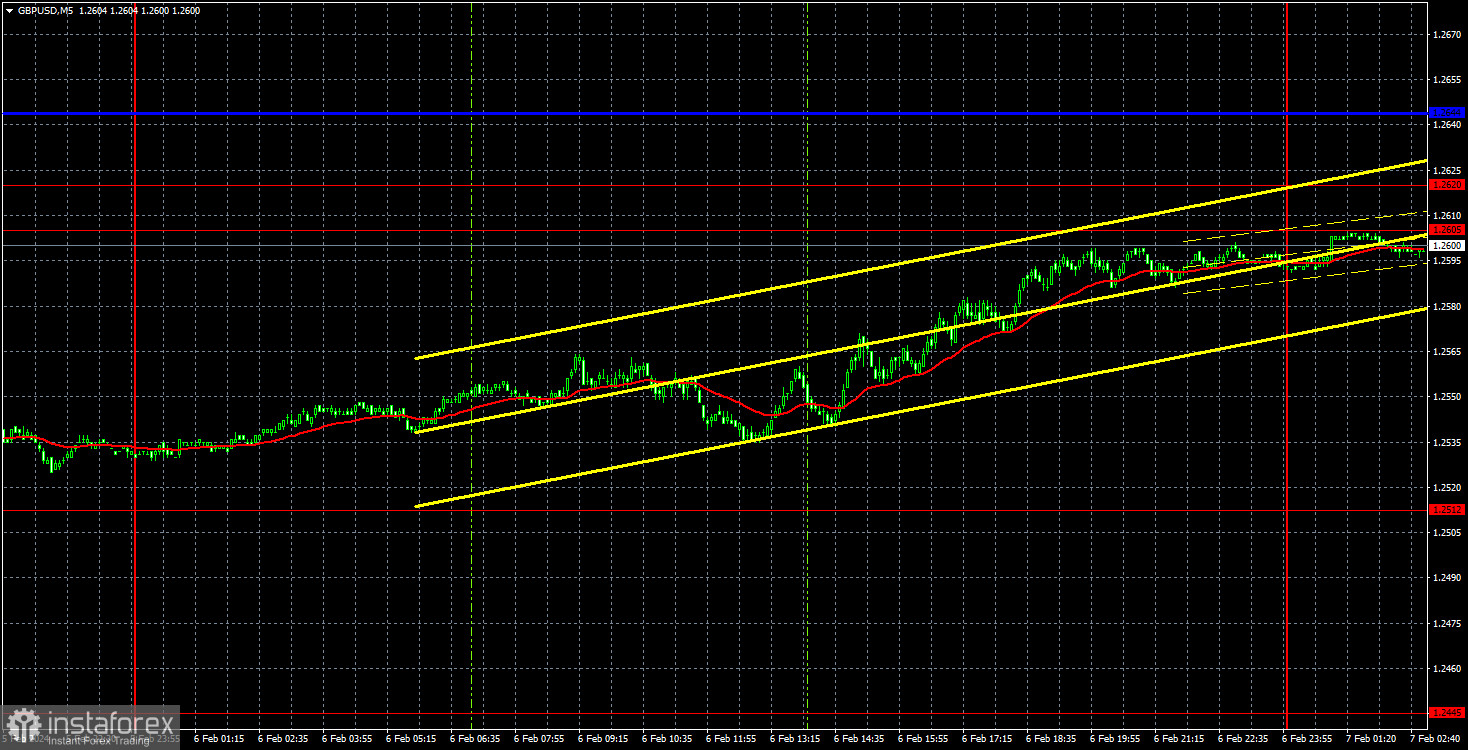
On Tuesday, GBP/USD bounced upwards strongly after a two-day decline. The pair has reached the area of 1.2605-1.2620, which has long served as the lower boundary of the sideways channel, preventing the price from falling below this mark. It is a critical moment for the pound. If the pair manages to return to the sideways channel, there's a high probability that this might bring back the flat phase. Otherwise, there may be tumultuous movements, making it very difficult to identify a clear trend. A rebound from the specified area would be an ideal scenario, and you can consider new short positions, maintaining the downtrend, and also anticipate a powerful and sustained decline in the British currency.
Yesterday, there were no fundamental or macroeconomic reasons for the pound to strengthen. Throughout the day, there were no significant events in the United States that could trigger the dollar's fall. The UK released a report on business activity in the construction sector, which exceeded forecast values but still remained below the key level of 50.0. We believe that the pair rose for purely technical reasons.
Unfortunately, no trading signals were generated yesterday. Despite its corrective nature, the upward movement was quite decent, making it possible to gain profit. However, the pair only encountered the level of 1.2605 during the night. The pair did not reach any of the levels or lines yesterday. Therefore, in the next few hours, we expect a signal to form in the 1.2605-1.2620 area.
COT report:

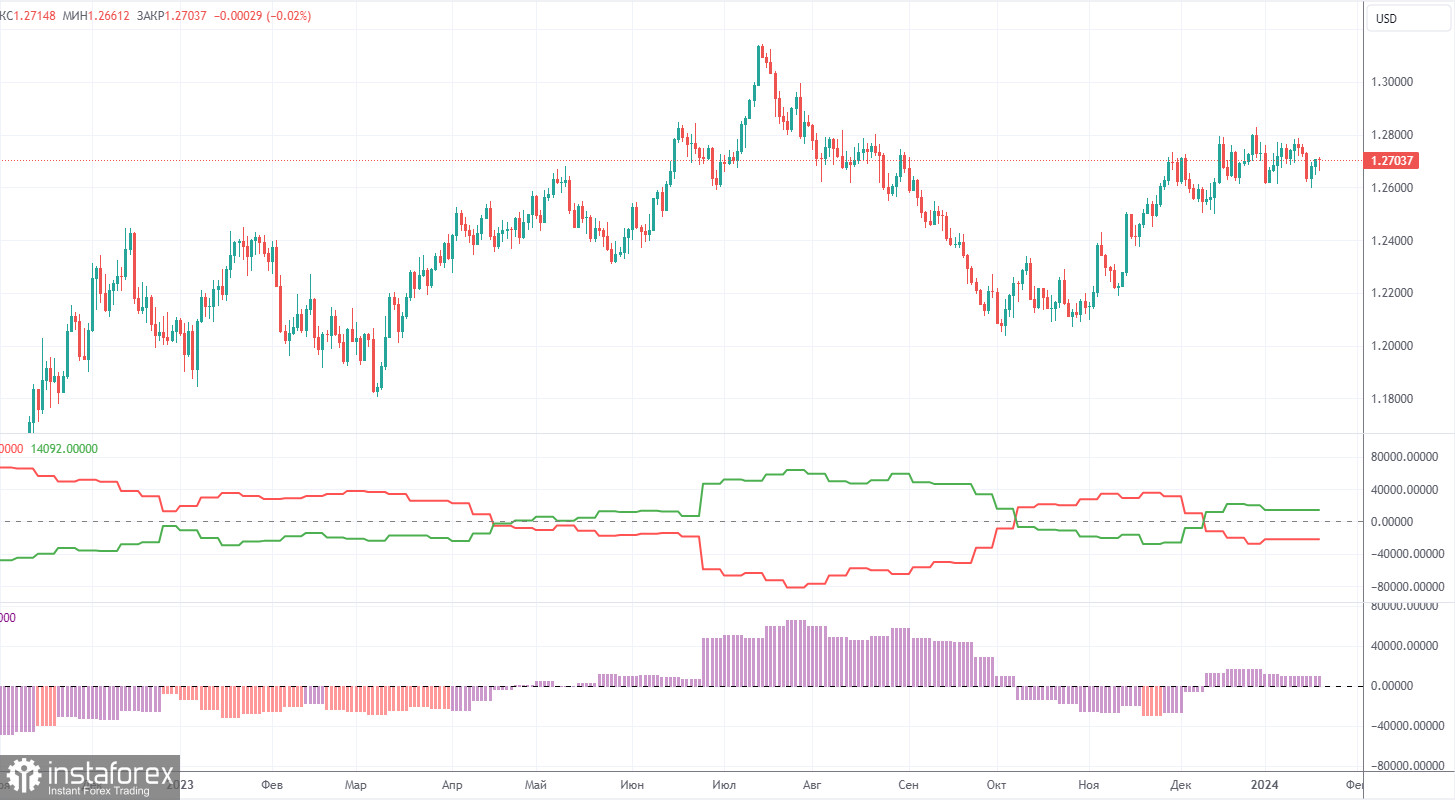
COT reports on the British pound show that the sentiment of commercial traders has been changing quite frequently in recent months. The red and green lines, representing the net positions of commercial and non-commercial traders, often intersect and, in most cases, are close to the zero mark. According to the latest report on the British pound, the non-commercial group opened 6,300 buy contracts and 5,800 short ones. As a result, the net position of non-commercial traders increased by 500 contracts in a week. The fundamental backdrop still does not provide a basis for long-term purchases on the pound.
The non-commercial group currently has a total of 72,600 buy contracts and 41,100 sell contracts. Since the COT reports do not provide an accurate forecast of the market's behavior at the moment, we need to pay close attention to the technical picture and economic reports. However, even these types of analysis are currently secondary because, despite everything, the market still maintains a bullish bias towards the pound, and the price has been in a flat range for the second month. The technical analysis suggests that there's a possibility that the pound could show a pronounced downward movement (but there are no clear sell signals yet), and for a long time now, the economic reports have also been significantly stronger in the United States than in the United Kingdom, but this has not benefited the dollar.
Analysis of GBP/USD 1H

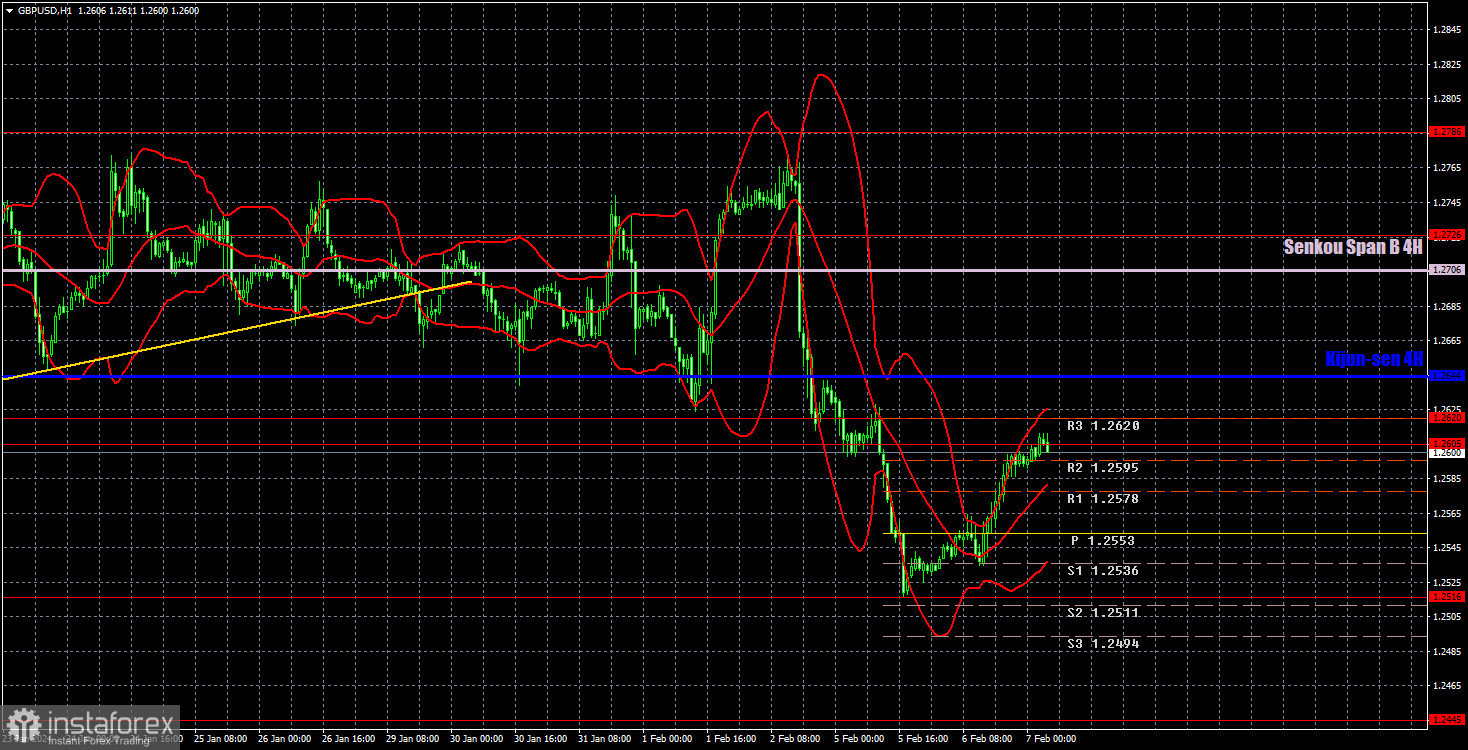
On the 1H chart, GBP/USD is no longer trading in the sideways channel and it may be on track to form a long-term downtrend. Since the last phase of growth (on the 24-hour timeframe) took several months, there is a possibility that the pound may continue to fall for several months. The targets of $1.18-$1.20 seem realistic since the pound currently lacks fundamental and macroeconomic support. There is a risk of reviving the flat phase if the price enters the sideways channel with boundaries at 1.2611-1.2787.
As of February 7, we highlight the following important levels: 1.2215, 1.2269, 1.2349, 1.2429-1.2445, 1.2513, 1.2605-1.2620, 1.2726, 1.2786, 1.2863, 1.2981-1.2987. The Senkou Span B (1.2706) and Kijun-sen (1.2644) lines can also serve as sources of signals. Don't forget to set a breakeven Stop Loss to breakeven if the price has moved in the intended direction by 20 pips. The Ichimoku indicator lines may move during the day, so this should be taken into account when determining trading signals.
Today, there are no significant events lined up in both the UK and the US. Several Federal Reserve officials will speak, but we believe that since Powell already spoke on the topic of monetary policy, there will be little more to add.
Description of the chart:
Support and resistance levels are thick red lines near which the trend may end. They do not provide trading signals;
The Kijun-sen and Senkou Span B lines are the lines of the Ichimoku indicator, plotted to the 1H timeframe from the 4H one. They provide trading signals;
Extreme levels are thin red lines from which the price bounced earlier. They provide trading signals;
Yellow lines are trend lines, trend channels, and any other technical patterns;
Indicator 1 on the COT charts is the net position size for each category of traders;
Indicator 2 on the COT charts is the net position size for the Non-commercial group.


