


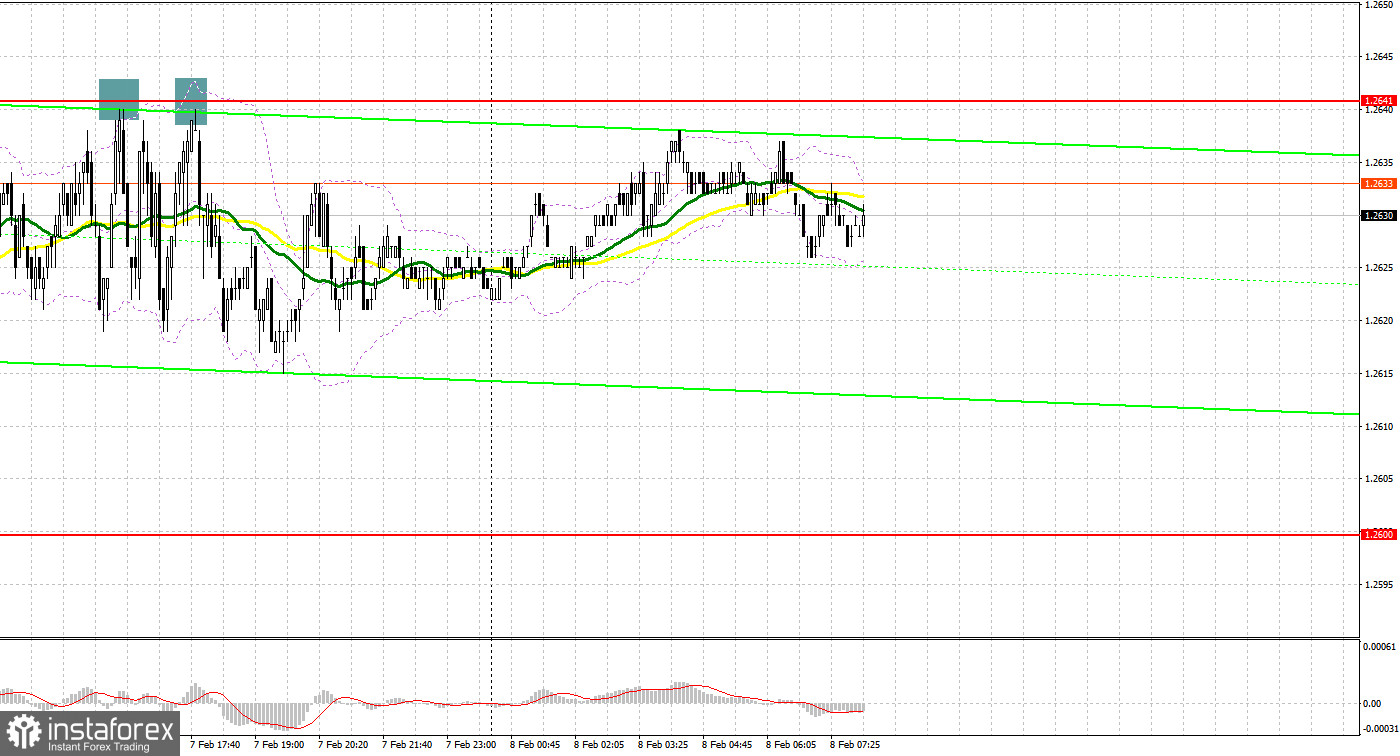
Yesterday, GBP/USD generated several signals to enter the market. Now let's look at the 5-minute chart and try to figure out what actually happened. In my morning forecast, I indicated the level of 1.2625 and planned to make decisions on entering the market from there. A rise and a false breakout at 1.2625 generated a sell signal, but the pair did not actively fall. Considering that the pair already traded above 1.2625, I decided to exit the market and reconsider the technical picture. In the afternoon, several unsuccessful attempts to rise above 1.2641 made it possible for us to enter the market in short positions with movements of 20 pips each.
For long positions on GBP/USD:
Yesterday, the market ignored Bank of England Deputy Governor for Financial Stability Sarah Breeden's speech, so nothing has changed. This morning, we can only highlight the speech of Catherine L. Mann, a member of the Bank of England's MPC, so don't be surprised if after a couple of unsuccessful attempts to continue the upward movement and touch the weekly highs, the pressure on the pound will return.
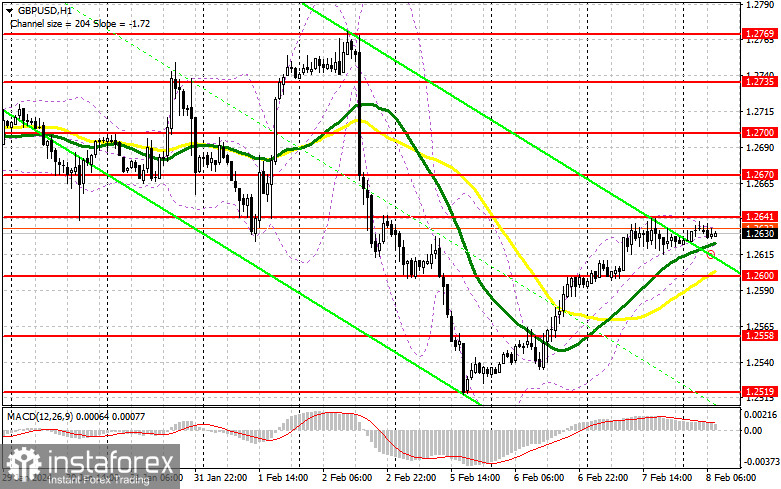
In case the statements exert pressure on the pair, only a false breakout near the new support at 1.2600, just above this level, we have the moving averages, will provide an entry point for long positions in hopes that the pair recovers, with the potential to test 1.2641. A breakout and consolidation above this range will strengthen the demand for the pound and open the way to 1.2670, which in itself is quite a strong correction. The farthest target will be the 1.2700 high, where I will take profits. In a scenario where GBP/USD falls and there are no bulls at 1.2600, we might see a new sell-off, which will bring back the bear market and crush the bulls' hopes that the pair would correct higher. A false breakout near the next support at 1.2558 will confirm the correct entry point. You can open long positions on GBP/USD immediately on a rebound from the low of 1.2519, bearing in mind an intraday correction of 30-35 pips.
For short positions on GBP/USD:
Sellers are in control of 1.2641, which is quite important at the moment since it can help determine the pair's direction. In case GBP/USD tries to recover in the first half of the day after the speeches of the Bank of England representatives, I plan to act after a false breakout in the resistance area of 1.2641. This would confirm the presence of big players in the market, creating a sell signal with the downward target at 1.2600. A breakout and an upward retest of this range will deal a serious blow to the bulls' positions, leading to the removal of stop orders and open the way to 1.2558, where I expect to see big buyers. A lower target will be the area of 1.2519, where I will take profits. If GBP/USD grows and there are no bears at 1.2641, the bulls will try to push harder in hopes of correcting further. In such a case, I would delay short positions until a false breakout at 1.2670. If there is no downward movement there, I will sell GBP/USD immediately on a bounce right from 1.2700, considering a downward correction of 30-35 pips within the day.
COT report:
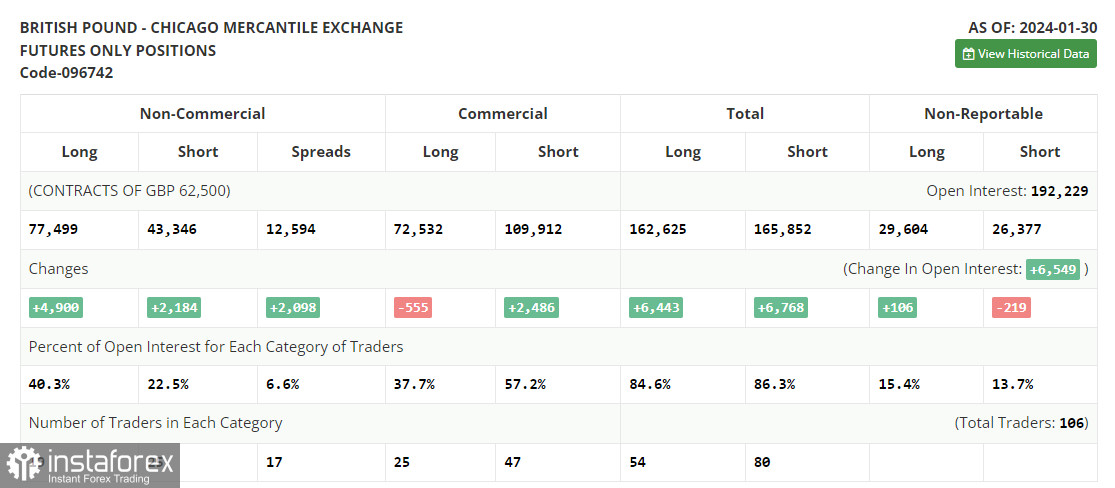
In the COT report (Commitment of Traders) for January 30, we find an increase in both long and short positions. Although traders already have a clear view of the future policy of the Bank of England, which intends to continue actively combating inflation despite clear signals from the economy that it's time to stop, the downward movement still resumed for the pound. This is because the central bank made it clear that it has no intention to raise rates further. Meanwhile, the U.S. maintains a wait-and-see position, so there's a high chance that we might see a larger pound sell-off after the bulls missed the annual low. The latest COT report said that long non-commercial positions rose by 4,900 to 77,499, while short non-commercial positions increased by 2,184 to 43,346. As a result, the spread between long and short positions increased by 2,098.
Indicator signals:
Moving Averages
The instrument is trading above the 30 and 50-day moving averages. It indicates an upward correction.
Please note that the time period and levels of the moving averages are analyzed only for the H1 chart, which differs from the general definition of the classic daily moving averages on the D1 chart.
Bollinger Bands
If GBP/USD falls, the indicator's lower boundary near 1.2620 will serve as support.
Description of indicators:
• A moving average of a 50-day period determines the current trend by smoothing volatility and noise; marked in yellow on the chart;
• A moving average of a 30-day period determines the current trend by smoothing volatility and noise; marked in green on the chart;
• MACD Indicator (Moving Average Convergence/Divergence) Fast EMA with a 12-day period; Slow EMA with a 26-day period. SMA with a 9-day period;
• Bollinger Bands: 20-day period;
• Non-commercial traders are speculators such as individual traders, hedge funds, and large institutions who use the futures market for speculative purposes and meet certain requirements;
• Long non-commercial positions represent the total number of long positions opened by non-commercial traders;
• Short non-commercial positions represent the total number of short positions opened by non-commercial traders;
• The non-commercial net position is the difference between short and long positions of non-commercial traders.


