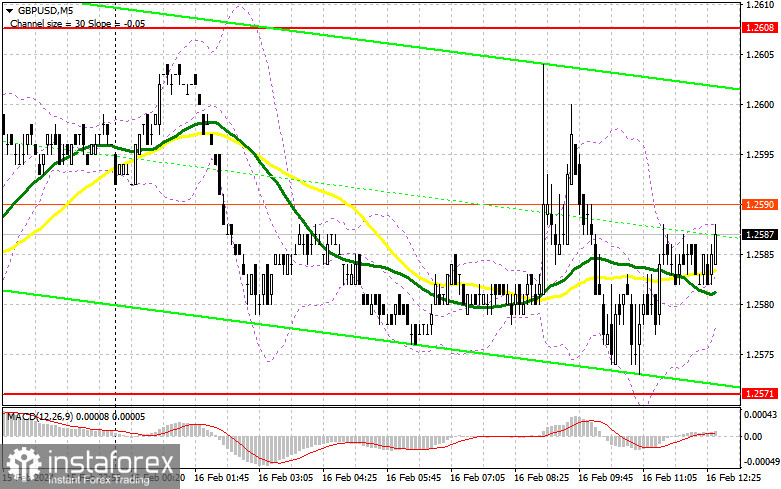
In my morning forecast, I paid attention to the 1.2571 level and planned to make decisions on entering the market from it. Let's look at the 5-minute chart and figure out what happened there. The decline occurred, but it never reached the formation of a false breakdown there. The very strong data on the UK did not save either, after which trade still remained within the side channel. In the afternoon, the technical picture was not revised.
To open long positions on GBP/USD, it is required:
The released data on retail sales in the UK exceeded economists' forecasts, which resulted in a spurt of the pound up, and so "strong" that we did not even reach today's maximum. As a result, now the entire calculation is based on data on the producer price index and the consumer sentiment index, along with inflation expectations from the University of Michigan. You can also listen to interviews with FOMC members Michael S. Barr and Mary Daly today. It is difficult to say how the dollar will react to all this, but if there is little positive, most likely the pound will make another attempt at growth.

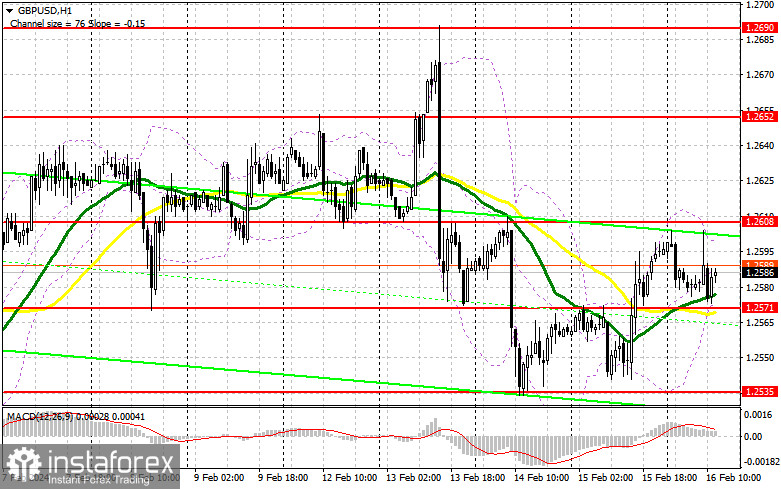
In the current situation, I will still look for entry points into long positions only on a decline in the area of 1.2571. There are also moving averages that play on the buyers' side. Only the formation of a false breakout there will provide a suitable entry point for buying, counting on a recovery of the pair towards 1.2608, a level that was just a couple of points short today. Breaking and consolidating above this range against weak US data will strengthen demand for the pound and open the way to 1.2652. The maximum target will be 1.2690, where I plan to make a profit. In the scenario of a pair decline and the absence of bullish activity at 1.2571 in the second half of the day, the pound may face another sell-off, returning to a bearish market. In this case, only a false breakout around the next support at 1.2535 will confirm the correct entry point. I plan to buy GBP/USD immediately on the rebound from the minimum of 1.2507, with a correction target of 30-35 points within the day.
To open short positions on GBP/USD, the following is required:
In case of another attempt to recover GBP/USD in the second half of the day, I plan to act only after the formation of a false breakout around the resistance at 1.2608. This will confirm the presence of major players in the market and lead to the opening of short positions with the aim of a decline to around 1.2571. Breaking and reverse testing of this range from bottom to top will deliver another blow to the bullish positions, leading to the removal of stop orders and opening the path to 1.2535, where I expect the emergence of significant buyers. The ultimate goal will be the area around 1.2507, where profit will be taken. In the case of GBP/USD rising and the absence of activity at 1.2608, buyers will try to regain control at the end of the week. In this case, I will postpone sales until a false breakout at 1.2652. If there is no downward movement, I will sell GBP/USD immediately on the rebound from 1.2690, but I am only counting on a pair correction down by 30-35 points within the day.
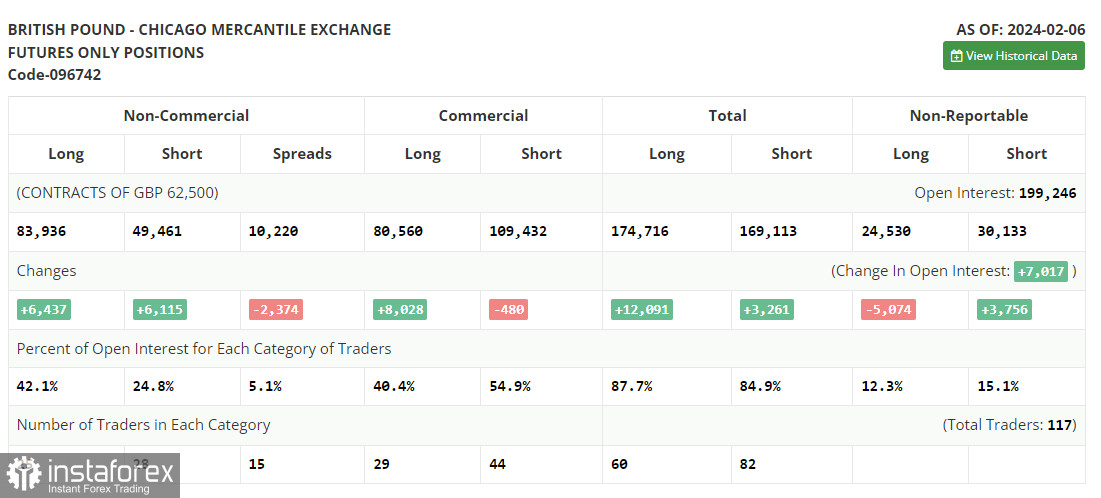
In the COT (Commitment of Traders) report for February 6, there was an increase in both short and long positions. Despite traders now clearly seeing the future policy of the Bank of England, which intends to continue actively combating inflation, the pound is taking time to demonstrate growth. Recent statements by British politicians indicate a soft wait-and-see position, which can change at any moment—if, of course, the data allows. In the near future, a lot of statistics on the labor market, wage growth, and inflation in the UK will be released, which could significantly change the balance of power in the market. But don't forget to add the Federal Reserve's wait-and-see position to all of this, so uncertainties are now greater. The latest COT report states that long non-commercial positions increased by 6,437 to 83,936, while short non-commercial positions jumped by 6,115 to 49,461. As a result, the spread between long and short positions decreased by 2,374.

Indicator signals:
Moving averages
Trading is conducted above the 30 and 50-day moving averages, indicating an attempt at a pound rise.
Note: The author considers the period and prices of moving averages on the hourly chart (H1) and differs from the general definition of classical daily moving averages on the daily chart (D1).
Bollinger Bands
In case of decline, the lower boundary of the indicator around 1.2571 will act as support.
Description of indicators:
Moving Average (MA) is a trend indicator that shows the current trend by smoothing volatility and noise. Period - 50. Marked on the chart in yellow.
Moving Average (MA) is a trend indicator that shows the current trend by smoothing volatility and noise. Period - 30. Marked on the chart in green.
MACD (Moving Average Convergence/Divergence) Indicator. Fast EMA - 12 period. Slow EMA - 26 period. SMA - 9 period.
Bollinger Bands. Period - 20.
Non-commercial traders are speculators, such as individual traders, hedge funds, and large institutions, using the futures market for speculative purposes and meeting certain requirements.
Long non-commercial positions represent the total long open position of non-commercial traders.
Short non-commercial positions represent the total short open position of non-commercial traders.
The total non-commercial net position is the difference between non-commercial traders' short and long positions.


