


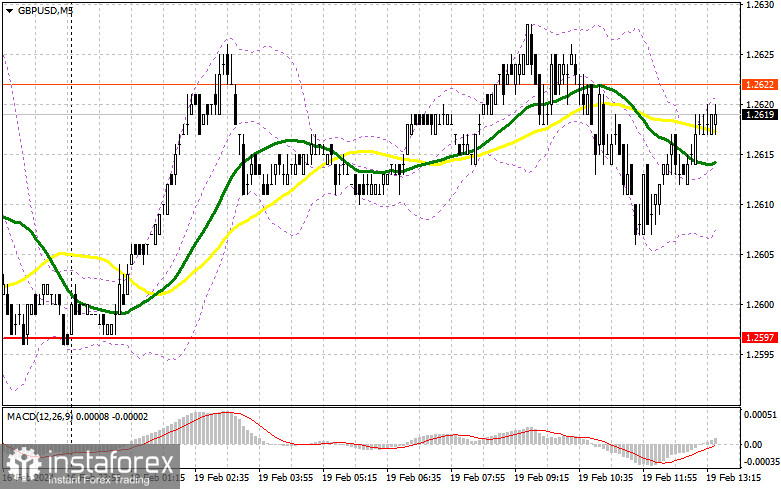
In my morning forecast, I paid attention to the 1.2597 level and planned to make decisions on entering the market from it. Let's look at the 5-minute chart and figure out what happened there. The decline occurred, but it never reached the formation of a false breakdown there. The reason was the excessively low volatility of the market against the background of the absence of any fundamental statistics. In the afternoon, the technical picture was not revised.
To open long positions on GBP/USD, it is required:
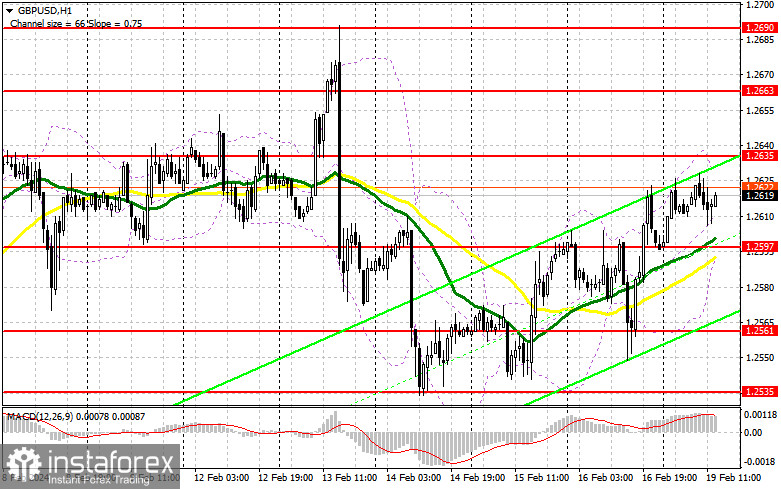
Considering that there are no macroeconomic indicators for the United States in the afternoon, as well as no interviews and speeches by representatives of central banks, we can conclude that trade will remain within the side channel, in which I prefer to act. I plan to look for entry points for long positions only on a decline to around 1.2597 – a new support formed at the end of last Friday. Moving averages and favoring buyers also intersect. Only the formation of a false breakout in that area will provide a suitable entry point for buying with the expectation of the pair's recovery to around 1.2635. A breakthrough and consolidation above this range will strengthen demand for the pound and open the way to 1.2663, which would already be a significant correction for the pound early in the week. The ultimate target will be around 1.2690, where I plan to make a profit. In the scenario of the pair's decline and the lack of activity on the part of bulls at 1.2597 in the second half of the day, the pound may undergo another sell-off, returning to a bearish market. In this case, only a false breakout in the area of the next support at 1.2561 will confirm the correct entry point into the market. I plan to buy GBP/USD immediately on a rebound from the minimum of 1.2535, targeting a 30-35 point correction within the day.
To open short positions on GBP/USD, the following is required:
In case of an attempt to recover GBP/USD in the second half of the day, in continuation of Friday's upward trend, I plan to act only after forming a false breakout around the resistance at 1.2635. This will allow me to ensure the presence of major players in the market and will lead to my opening short positions with the goal of a decline to around 1.2597. A breakthrough and a bottom-up retest of this range will deliver another blow to the bulls' positions, removing stop orders and opening the way to 1.2561, where I expect the emergence of significant buyers. The ultimate target will be around 1.2535, where profits will be taken. Buyers will continue the upward correction in the scenario of GBP/USD rising and the lack of activity at 1.2635 in the second half of the day. In this case, I will postpone sales until a false breakout at 1.2663. If there is no downward movement, I will sell GBP/USD immediately on a rebound from 1.2690, but only with the expectation of a pair correction down by 30-35 points within the day.
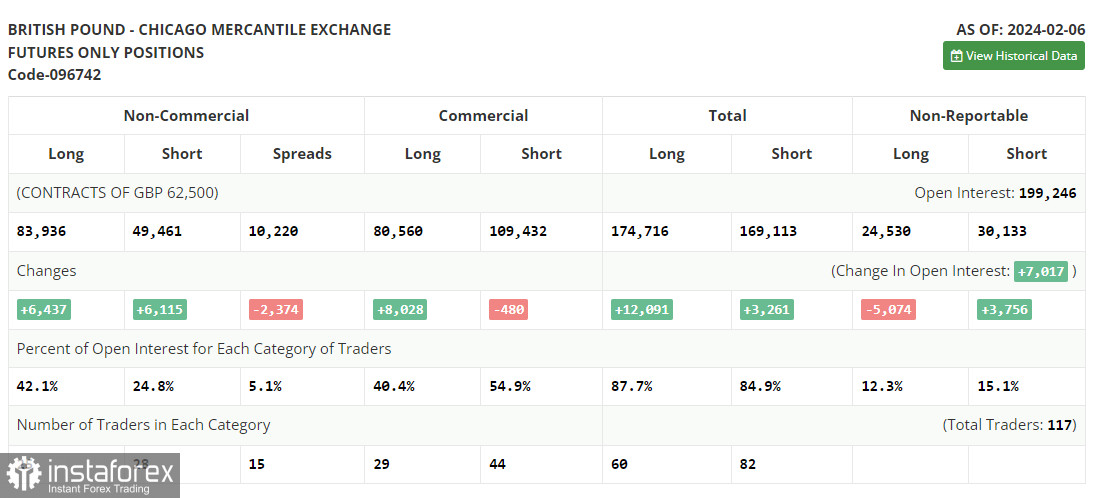
The COT report (Commitment of Traders) for February 6 showed an increase in both short and long positions. Despite the clear vision traders now have of the Bank of England's future policy, which intends to continue actively combating inflation, the pound is quick to demonstrate growth. The latest statements by British politicians indicate a soft, wait-and-see position, which can change at any moment – if, of course, the data allows. A lot of labor market statistics, wage growth, and inflation in the UK will be released soon, which can significantly change the balance of power in the market. But don't forget to add the Federal Reserve's wait-and-see position to all this, so uncertainties are now greater than before. In the last COT report, it is stated that long non-commercial positions increased by 6,437 to the level of 83,936, while short non-commercial positions jumped by 6,115 to the level of 49,461. As a result, the spread between long and short positions decreased by 2,374.
Indicator signals:
Moving Averages
Trading is conducted above the 30 and 50-day moving averages, indicating an attempt to raise the pound.
Note: The author considers the period and prices of moving averages on the hourly chart H1, which differs from the general definition of classical daily moving averages on the daily chart D1.
Bollinger Bands
In case of a decrease, the lower boundary of the indicator, around 1.2597, will act as support.
Description of indicators
• Moving average (determines the current trend by smoothing volatility and noise). Period 50. Marked on the chart in yellow.
• Moving average (determines the current trend by smoothing volatility and noise). Period 30. Marked on the chart in green.
• MACD indicator (Moving Average Convergence/Divergence). Fast EMA period 12. Slow EMA period 26. SMA period 9
• Bollinger Bands. Period 20
• Non-commercial traders - speculators, such as individual traders, hedge funds, and large institutions, use the futures market for speculative purposes and meet certain requirements.
• Long non-commercial positions represent the total long open position of non-commercial traders.
• Short non-commercial positions represent the total short open position of non-commercial traders.
• The total non-commercial net position is the difference between non-commercial traders' short and long positions.


